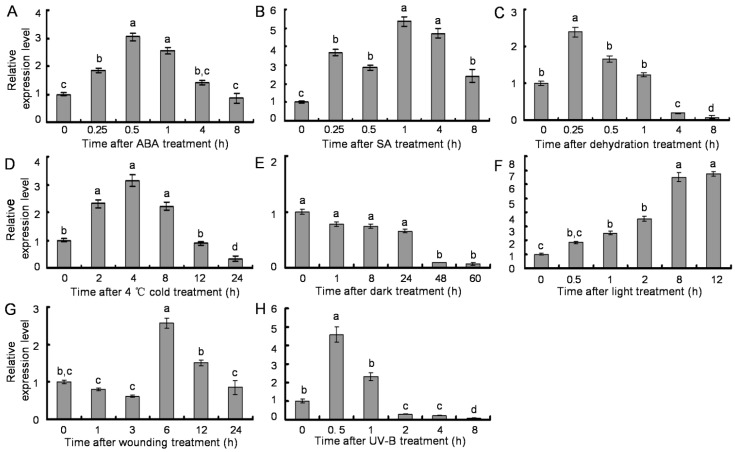
Figure 7.
Transcription pattern of SsPAL1 under different treatments by qRT-PCR analysis. (A) 100 μM ABA; (B) 500 μM SA; (C) dehydration; (D) 4 °C cold; (E) dark; (F) 25 °C in 24,000 Lx light; (G) wounding; and (H) 1500 μJ/m2 UV-B. The results were analyzed using the comparative Ct method and presented as fold changes compared to 0 h untreated leaves (2−∆∆Ct). All reactions were carried out in triplicate, and each experiment was repeated twice. The same lowercase letter is not significantly different (p > 0.05).

