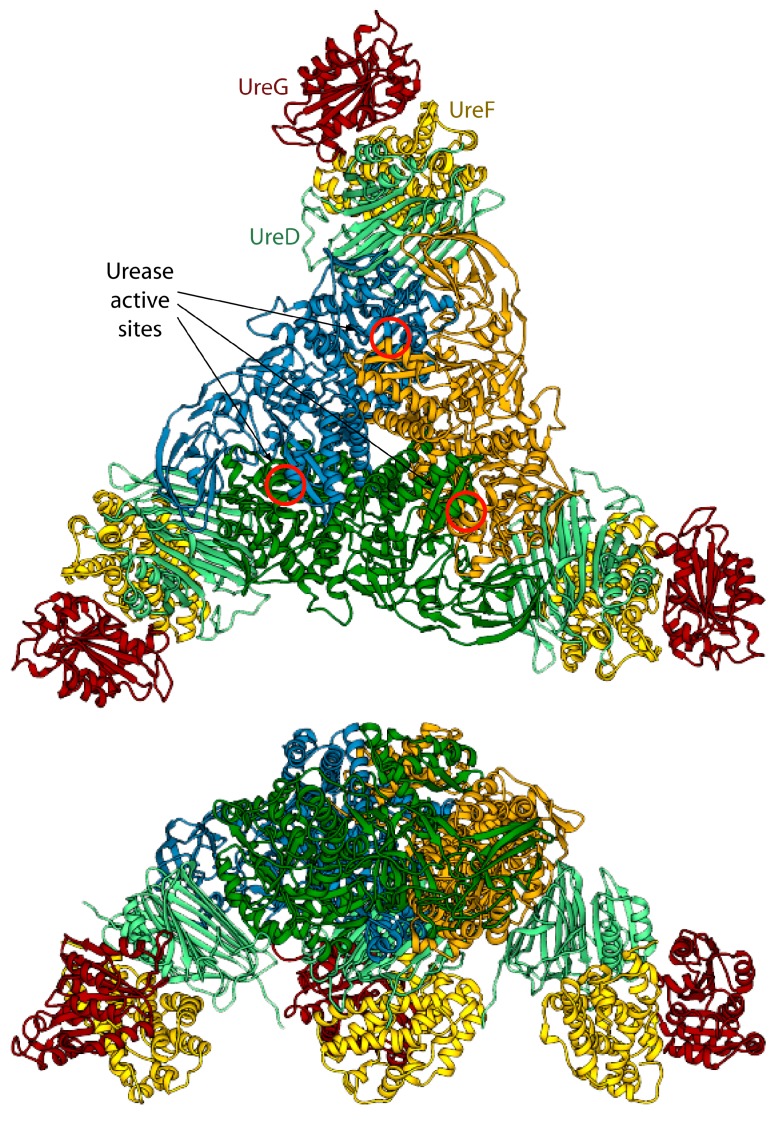
Figure 4.
Ribbon scheme of the KAU–UreDFG model complex as calculated in ref. [73]. Ureases subunits and accessory protein are colored as in Figure 1 and Figure 2, respectively. The position of the KAU active sites is indicated by red circles. The views in the top and bottom panel are rotated by 90° along the horizontal axis.

