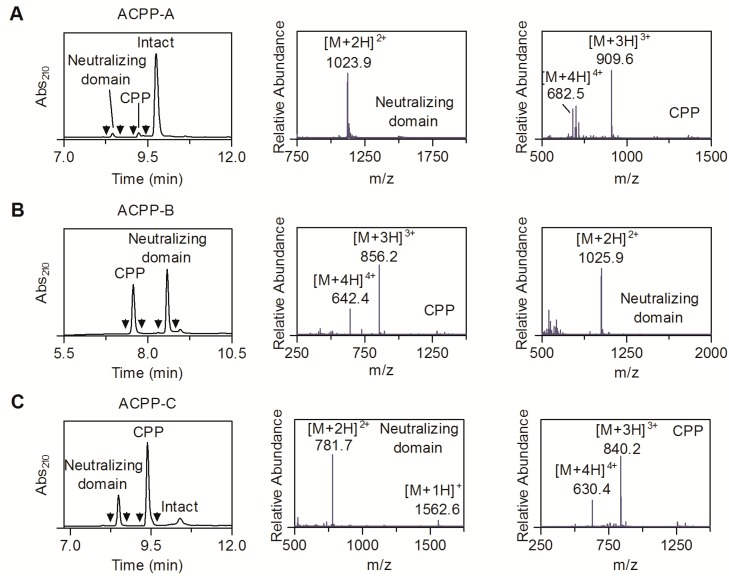
Figure 3.
LC-MS characterization of ACPP-A, ACPP-B, and ACPP-C (0.1 mM) incubated with MT1-MMP (0.13 µM) for 60 min. The left and right graphs show the UV absorbance chromatogram and the mass spectra of the UV-peaks bracketed by the arrowheads, respectively. (A) ACPP-A; MS spectra of Neutralizing domain (obsd. 2244.8 Da, calcd. 2244.8 Da for Ac-y-e9-X-C*PKESC*N-COOH), and CPP (obsd. 2724.7 Da, calcd. 2724.7 Da for H2N-LFVLKD-X-r9-dab(DOTA)-NH2). (B) ACPP-B; MS spectra of CPP (obsd. 2565.5 Da, calcd. 2565.5 Da for H2N-LRDSG-X-r9-k(DOTA)-NH2), and Neutralizing domain (obsd. 2049.8 Da, calcd. 2049.8 Da for Ac-y-e9-X-CRPAH-COOH). (C) ACPP-C (without SHPP functionality); MS spectra of Neutralizing domain (obsd. 1561.5 Da, calcd. 1561.5 Da for e9-x-PLA-COOH), and CPP (obsd. 2517.4 Da, calcd. 2517.4 Da for H2N-CmobWAR-X-r8-k(DOTA)-NH2). C* represents cysteine residues that are linked via an intramolecular disulfide bridge.

