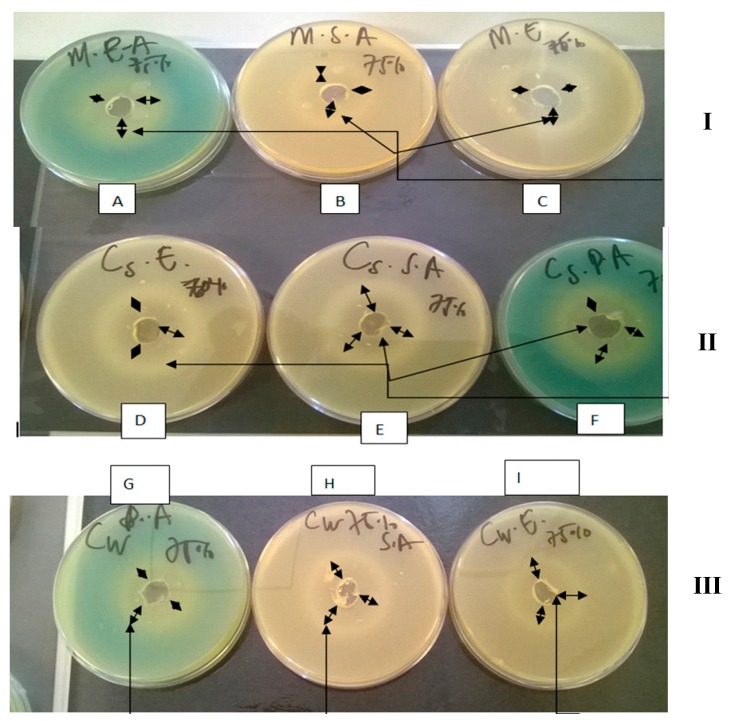
Figure 1.
Agar plates showing the zones of inhibition generated by 75% w/v solution of the various honeys: [I] M honey against Pseudomonas aeruginosa (A), Staphylococcus aureus (B) and Escherichia coli (C); [II] CS honey against Escherichia coli (D); Staphylococcus aureus (E) and Pseudomonas aeruginosa (F); [III] CW honey against Pseudomonas aeruginosa (G); Staphylococcus aureus (H) and Escherichia coli (I). The long single head arrows ( ) indicate the positions of the zones of inhibition whilst the short double head arrows (
 ) indicate the diameter of the zones of inhibition.

