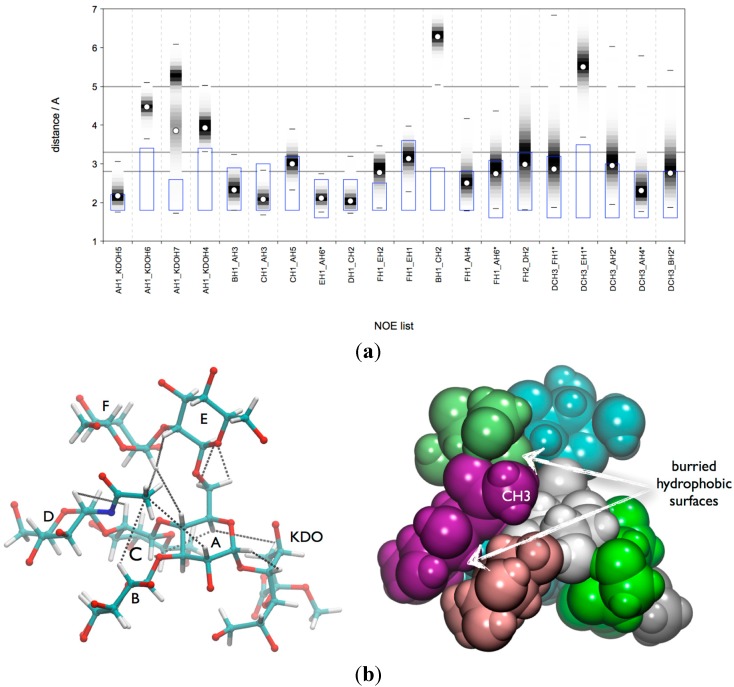
Figure 5.
lgt2Δ OS: (a) Comparison of the calculated reff derived from a 300 ns MD simulation at 300 K of the (1-4)anti-ψ(1-6)gg conformation with the experimental NOE restraints. Calculated average reff is shown as white circle; histogram of the distances is shown in the background with darker shading meaning higher population. The experimental NOE restraints are indicated with a blue box; (b) A representative 3D structure of the (1-4)anti-ψ(1-6)gg conformation. The fulfilled NOE restraints are indicated as dotted lines (Left). Space filling model (Right).

