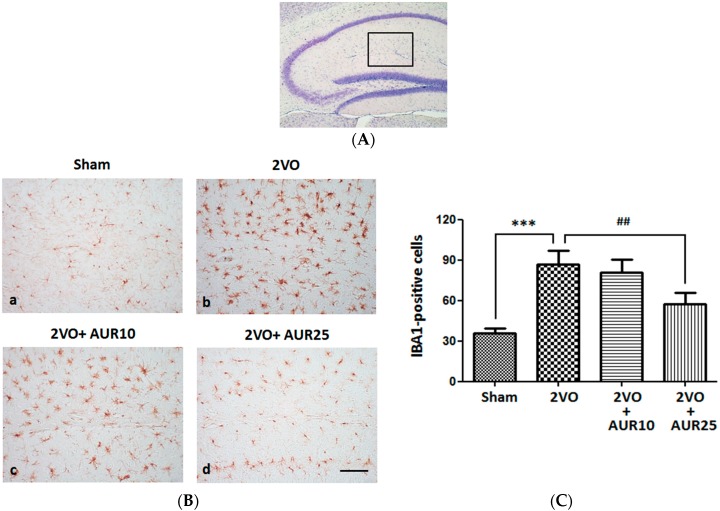
Figure 1.
Effects of AUR on the activation of microglia in the hippocampus. (A) Region within the hippocampal region for observations of IBA-1-positive cells; (B) Representative photographs of IBA-1-positive cells in the indicated groups. The scale bar indicates 100 µm; (C) Number of IBA-1-positive cells in the four groups. Values are the means ± SEM (15~18 sections in each group). *** p < 0.001; and ## p < 0.01, as indicated by the brackets.

