Figure 2.
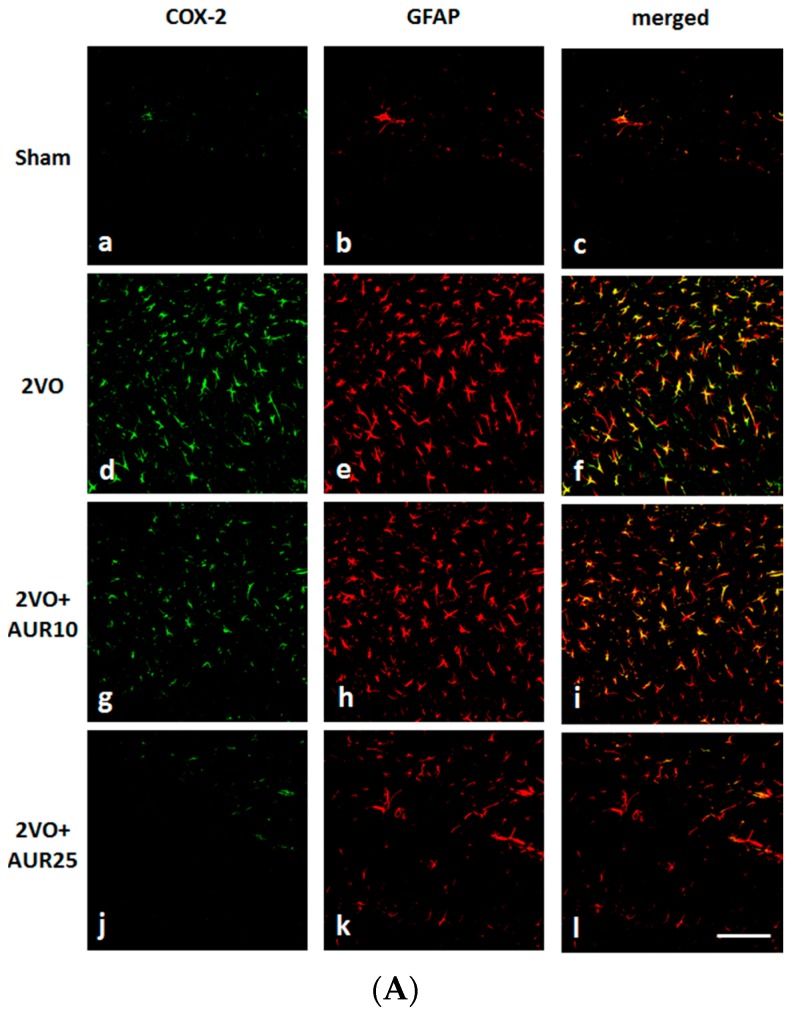
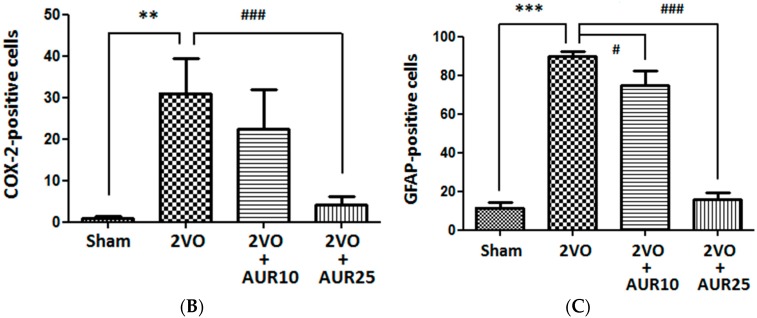
Effects of AUR on the expression of COX-2 and GFAP in the hippocampus. (A) Representative photographs of COX-2-positive cells (green; a, d, g, j), GFAP-positive cells (red; b, e, h, k), and cells co-expressing COX-2 and GFAP (yellow; c, f, i, l). The scale bar indicates 100 µm; (B) The numbers of COX-2-positive cells; and (C) GFAP-positive cells are shown. Values are the means ± SEM (6 sections in each group). ** p < 0.01; *** p < 0.001; # p < 0.05; and ### p < 0.001, as indicated by the brackets.


