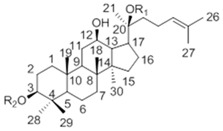
Table 4.
13C-NMR chemical shifts of metabolite (3) in comparison with ginsenoside Rh2 and CK.
| Carbon Site |  |
||
|---|---|---|---|
| CK R1 = Glc, R2 = H |
Metabolite (3) | Rh2 R1 = H, R2 = Glc |
|
| 1 | 39.19 | 38.62 | 39.12 |
| 2 | 28.05 | 27.21 | 27.05 |
| 3 | 77.83 | 78.16 | 88.78 |
| 4 | 39.34 | 38.87 | 39.66 |
| 5 | 56.14 | 56.92 | 56.35 |
| 6 | 18.55 | 18.01 | 18.43 |
| 7 | 34.95 | 34.47 | 35.15 |
| 8 | 39.86 | 39.59 | 40.00 |
| 9 | 50.09 | 51.01 | 50.38 |
| 10 | 37.14 | 36.79 | 36.94 |
| 11 | 30.56 | 29.62 | 32.02 |
| 12 | 69.96 | 69.86 | 70.96 |
| 13 | 49.30 | 49.69 | 49.54 |
| 14 | 51.21 | 51.66 | 51.69 |
| 15 | 30.74 | 30.23 | 31.32 |
| 16 | 26.42 | 26.62 | 26.70 |
| 17 | 51.39 | 51.77 | 54.77 |
| 18 | 15.81 | 15.28 | 16.77 |
| 19 | 16.14 | 15.80 | 15.61 |
| 20 | 83.08 | 83.55 | 72.94 |
| 21 | 22.13 | 22.83 | 26.83 |
| 22 | 35.96 | 35.28 | 35.88 |
| 23 | 22.98 | 22.83 | 22.97 |
| 24 | 125.75 | 124.45 | 126.30 |
| 25 | 130.69 | 130.88 | 130.73 |
| 26 | 25.54 | 25.80 | 25.78 |
| 27 | 17.54 | 16.94 | 17.66 |
| 28 | 28.47 | 29.62 | 28.14 |
| 29 | 16.14 | 16.51 | 16.34 |
| 30 | 17.18 | 16.94 | 17.65 |
| Glucosyl C-1″ | 98.10 | 96.92 | 106.92 |
Major differences were highlighted in bold.
