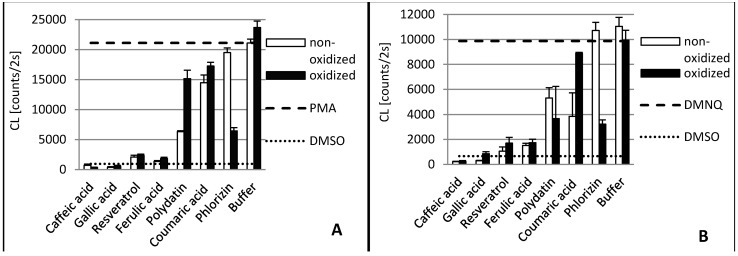
Figure 3.
Antioxidant capacity of phenolic compounds as well as their laccase oxidation products in THP1 (A) and EA.hy 926 (B) cells. In order to stimulate ROS production PMA was added to THP1 cells and DMNQ to EA.hy 926 cells, respectively. Due to interaction with ROS, added L-012 exhibits chemiluminescence (CL), which was detected. The PMA/DMNQ lines represent maximum ROS production by stimulated cells. The DMSO line shows the ROS signal in cells without stimulation. Buffer: tartrate-malate buffer (30 mM, pH 3.5) without phenolics.

