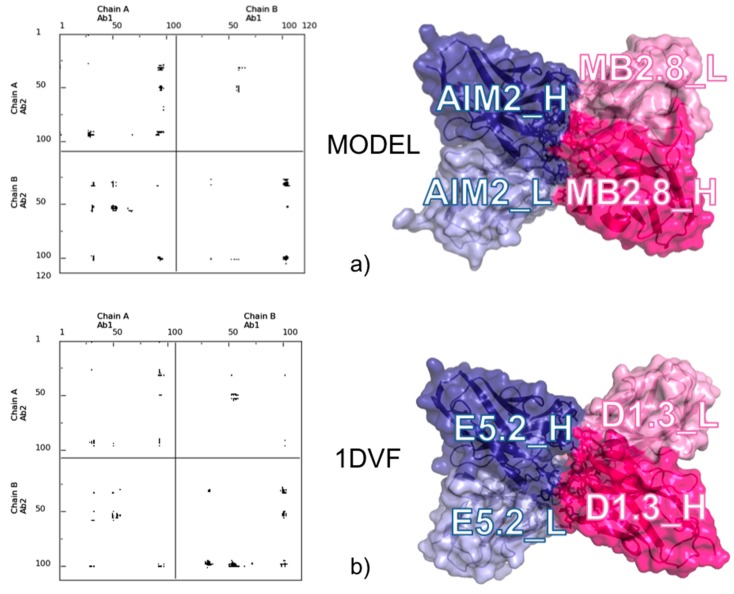
Figure 3.
Comparison between the selected docking model for the MB2.8-AIM2 complex and the X-ray structure of the D1.3-E5.2 Ab1-Ab2 complex (1DVF [41]). (a) Contact map (left) and surface representation (right) of MB2.8-AIM2; and (b) contact map (left) and surface representation (right) of D1.3-E5.2. Labels have been added for the Ab1’s and Ab2’s light and heavy chains.

