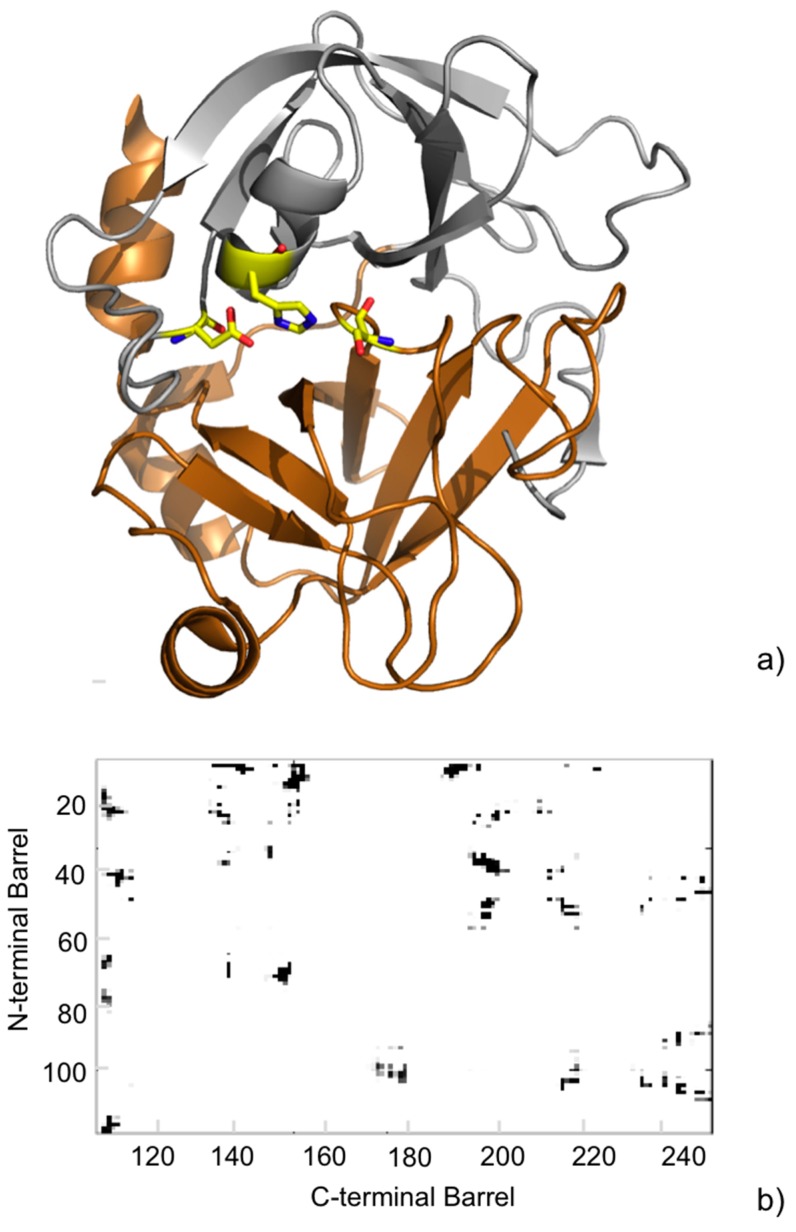
Figure 5.
(a) Cartoon representation of the crystallographic structure of the catalytic domain of human FXa (PDB ID: 2BOH [45]). The N-terminal β-barrel is oriented up (gray) and the C-terminal β-barrel down (copper). Residues of the catalytic triad are shown as yellow sticks; (b) Inter-barrel consensus contact map from the MD simulations. The observed contacts are colored in a gray scale to indicate their frequency during the MD simulation. The paucity of gray spots in the map indicates a rigidity of the contacts at the interface.

