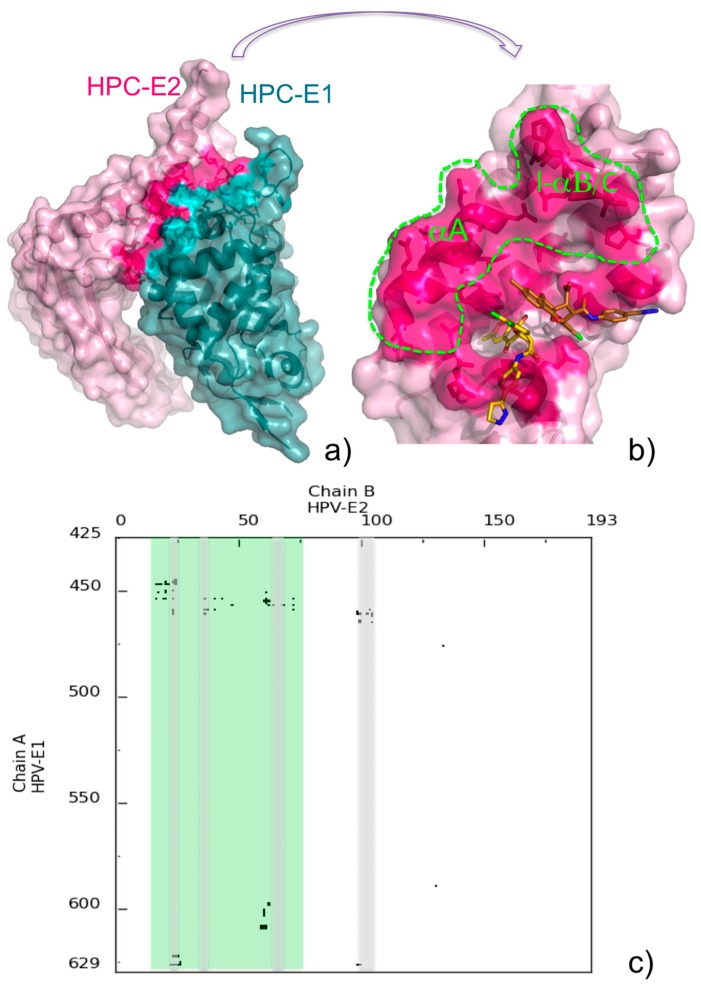
Figure 6.
(a) COCOMAPS 3D representation of the HPC E1-E2 complex (PDB ID: 1TUE), with interface residues highlighted in teal and hot pink, respectively; (b) Inhibitor molecules binding to E2 in the 1R6N complex are shown on the E2 interface colored and displayed as in (a). The inhibitor molecules A and B (see text) are colored gold and copper, respectively. The E2 interface untargeted by inhibitors is rimmed with a green dashed line. Labels have been added for the E2 helix A (αA) and the loop between helix B and C (l-αB/C); (c) Contact map of the HPC E1-E2 complex. E2 regions contacted by the inhibitors are shadowed in gray, and other regions available for possible inhibitor binding are shadowed in green.

