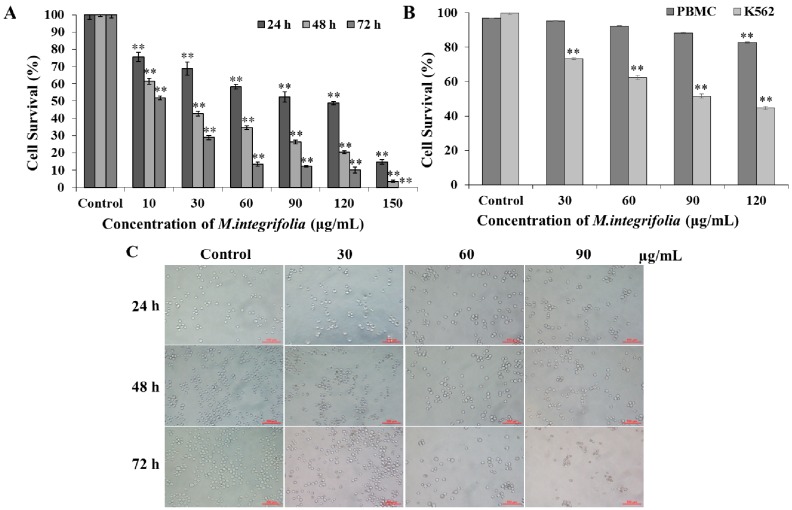
Figure 1.
Cell viability tests. (A) K562 cells viability after M. integrifolia treatment was measured by MTT assay; (B) Cytotoxicity effect of M. integrifolia on PBMCs and K562 cells through Typan blue assay; (C) After treatment with different concentrations of M. integrifolia for 24, 48 and 72 h, cell morphology was observed by a phase-contrast microscopy. Each value was expressed as a mean ± S.D. of at least three independent determinations. One-way ANOVA was used for comparisons of multiple group means followed by Dunnett’s t-test. ** p < 0.01 vs. Control. (Error bars = S.D., n = 3).

