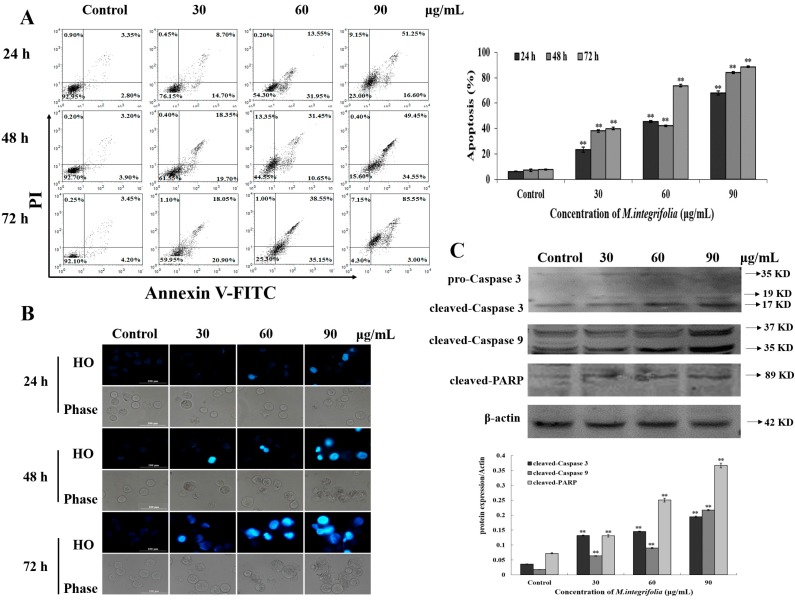
Figure 3.
Apoptosis detection in M. integrifolia-treated cells. (A) The quantification of apoptotic cells. K562 Cells were double-stained with Annexin V-FITC and PI, and then analyzed by flow cytometry; (B) Effects of M. integrifolia on cell morphology and nucleus of K562 cells. Cells treated for 24, 48 and 72 h were stained with Hoechst 33342. Morphological changes were observed under fluorescent microscope. All experiments were done independently in triplicate per experimental point, and representative results were shown. The results represented the mean ± S.D. of three independent experiments. ** p < 0.01 indicated statistically significant differences vs. Control; (C) Effects of M. integrifolia on the expression of some key apoptotic proteins in K562 cells. K562 cells were treated with M. integrifolia for 24 h. Western blot analysis was performed in triplicate per experimental point; β-actin was used as reference control.

