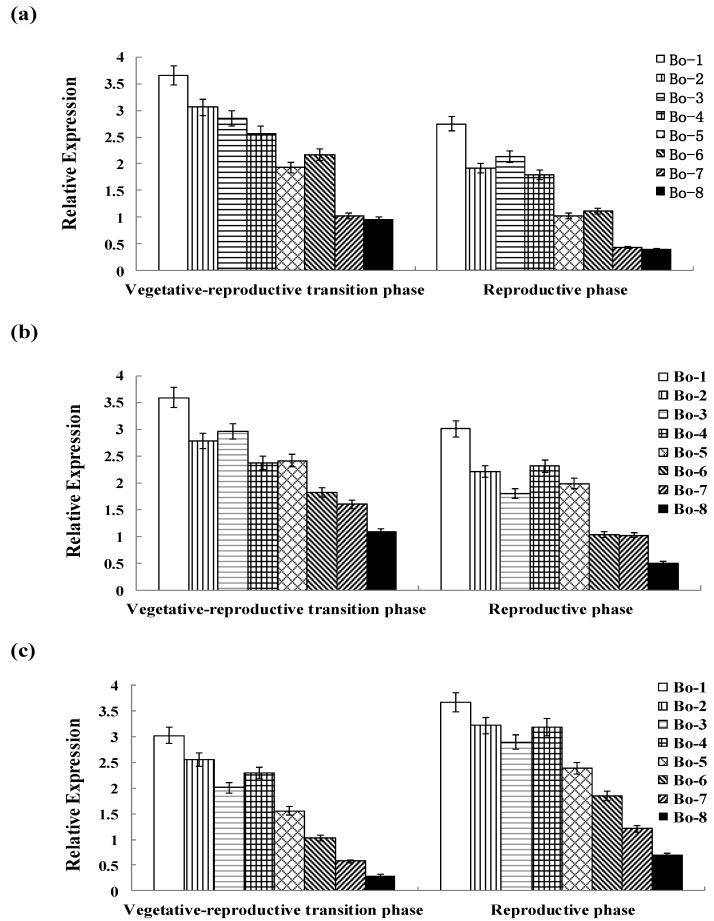
Figure 4.
(a) Genotypic expression patterns of BCAT4; (b) Genotypic expression patterns of MAM1; (c) Genotypic expression patterns of CYP79F1. The stages are defied as: vegetative–reproductive transition phase (the elongated stems) and reproductive phase (stems with inflorescence). Each bar represents the mean (±standard error) of three independent biological replicates.

