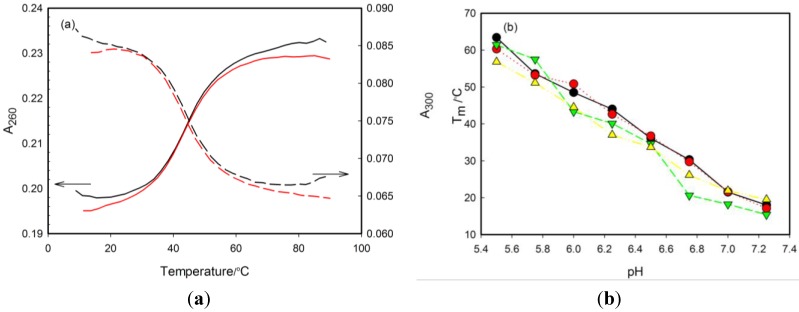
Figure 2.
(a) The melting profile of 1tC probe at the pH 6.25. The presented curves illustrate cooling (black lines) and heating (red lines) experiments recorded at 260 nm (solid lines) and at 300 nm (dashes lines). The scales for the 260 nm and 300 nm readings are notably different. (b) Temperature melting values of tC-modified– probes: 1tC (red), 3tC (green) and 6tC (yellow) and unmodified 5′-(C4G)3C4A-3′ sequence (black) plotted against pH.

