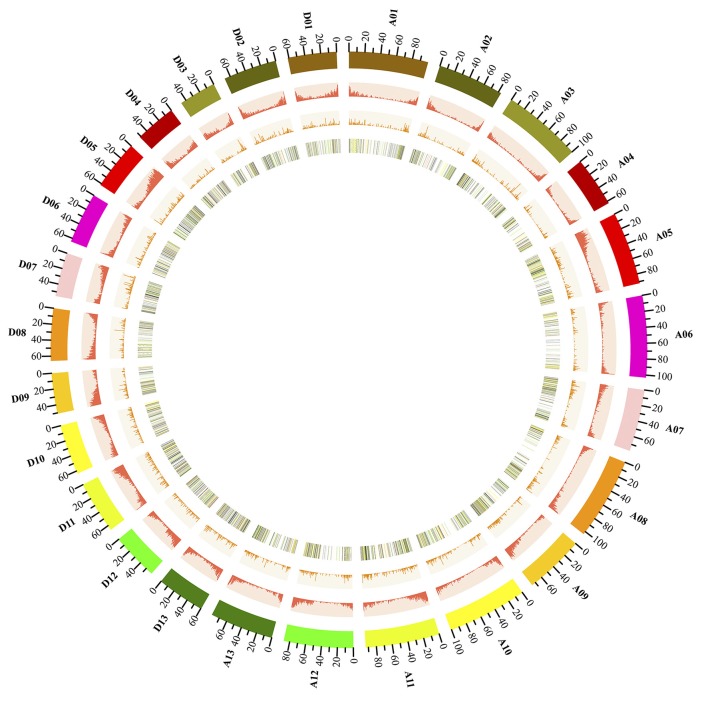
Figure 3.
Genome-wide distribution of cotton lncRNAs compared with that of protein-coding genes. Chromosomes A0-13 and D0-13 are shown with different colors and in a circular form as the outer thick track. The chromosome scale (Mb) is labeled on each chromosome. On the second track (outer to inner), the red columns show the abundance of protein-coding genes in physical bins of 500-kb for each chromosome. For the third track, the orange columns show the abundance of lncRNAs in 500-kb windows. On the inner track is the heat map showing the ratio of averaged fragments per kilobase of exon per million fragments mapped (FPKM) values (AZD/DMSO) of lncRNA. Each vertical line on the inner track reports the location of lncRNAs throughout the whole cotton genome; the black lines represent lncRNAs with a fold change of FPKM < 0.5, the green lines show the fold change of FPKM >0 and < 1; the yellow lines show the fold change of FPKM ≥1 and < 2; the red lines show the fold change of FPKM ≥2.

