
Table 1.
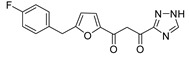
Selected aryl or heteroaryl diketo acid integrase inhibitors.
| Compound | (ST) IC50, μM * | Anti-HIV Data EC50 or EC95 (μM) * and Cell Line | Cytotoxicity CC50 or CC95 (μM) * and Therapeutic Index (TI) * | References |
|---|---|---|---|---|
1 L-708,906 |
0.10 3.5 |
EC50, 2.0 H-9 Cells EC50, 5.5 MT-4 Cells |
CC50, 88.3 (TI = 16) |
[26,34] |
2 |
0.35 Mn2+ |
EC50, 0.6 293T Cells |
- | [36] |

3 |
<0.10 | EC95, 0.52 MT-4 Cells |
- | [27] |
4 |
<0.10 | EC95, 1.11 MT-4 Cells |
CC95, >50 (TI > 45) |
[27] |
5 |
<0.10 | EC95, 0.10 MT-4 Cells |
CC95, >50 (TI > 500) |
[27] |
6 |
1.53 Mn2+ |
EC50, 2.1 293T Cells |
CC50, >50 (TI > 24) |
[27] |
7 |
2.4 Mn2+ |
EC50, 5 293T Cells |
CC50, >50 (TI > 10) |
[44] |
8 L-731,988 |
0.17 | EC50, 1.0 H-9 EC95, 9.6 MT-4 Cells |
- | [26,27] |
9 |
7.0 | EC50, 1.5 MT-4/KB Cells |
61 TI = 41 |
[45] |
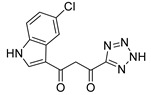
10 5ClTEP |
0.65 Mn2+ |
- | - | [36] |
11 (S-1360) |
0.02 | EC50, 0.14 PBMC |
CC50, 110 (TI = 786) |
[32,33] |
* IC50 is the concentration for 50% inhibition of the specified step of integrase activity. EC50 is the concentration for 50% inhibition of virus replication. EC95 is the concentration for 95% inhibition of virus replication. CC50 is the concentration to reduce cell viability by 50%. CC95 is the concentration to reduce cell viability by 95%. TI (therapeutic index) is the ratio of CC50 to EC50.