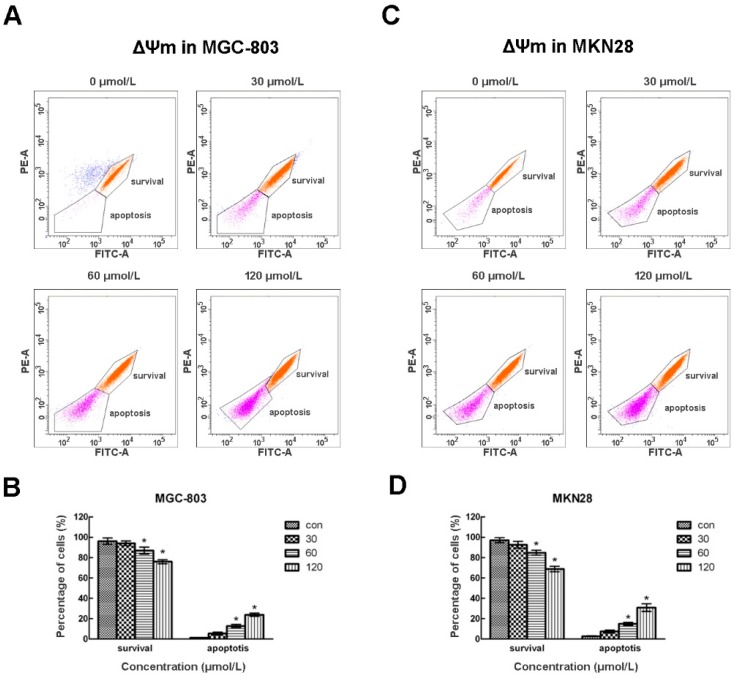
Figure 4.
CVB-D results in loss of ΔΨm in MGC-803 and MKN28 cells. (A,C) Representative flow cytometry graphs of ΔΨm of CVB-D (0, 30, 60 and 120 µmol/L) treated MGC-803 (A); and MKN28 cells (C); (B,D) Statistic analysis of cells numbers at different populations of CVB-D treated MGC-803 (B); and MKN28 cells (D). Rh123+, Survival cells; Rh123−, apoptotic cells. * p < 0.05. Each experiment involved at least three replicates.

