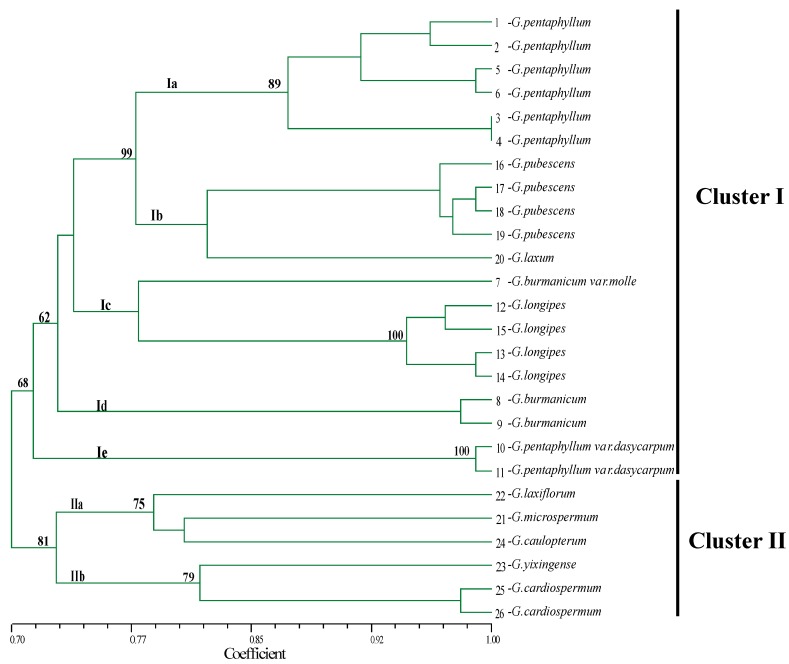
Figure 7.
Genetic relationships among Gynostemma species based on EST-SSR markers. Genetic relationships among 26 individual plants. The scale at the bottom of the dendrogram indicates the level of similarity between the genotypes. Bootstrap values (>50) were labeled on the branches from 1000 re-samplings.

