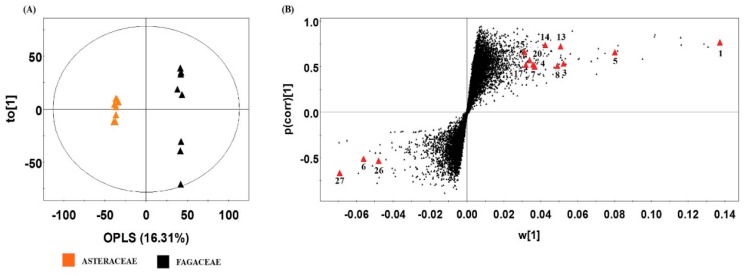
Figure 4.
Orthogonal partial least squares discriminant analysis (OPLS-DA) score plot (A) and loading S-plot (B) derived from the ultrahigh performance liquid chromatography (UHPLC)-linear trap quadrupole-ion trap (LTQ-IT) mass spectrometry/mass spectrometry (MS/MS) dataset for Fagaceae and Asteraceae: R2X(0.281), R2Y(0.999), and Q2(0.854); R2X is all the Xs explained by the component, R2Y is all the Ys explained by the component, and Q2 is total variation of the Xs and Ys that can be predicted by the component. The significantly different metabolites (p-value < 0.05) are highlighted in the S-plot. The numbers indicated on the loading S-plot are based on Table 2.

