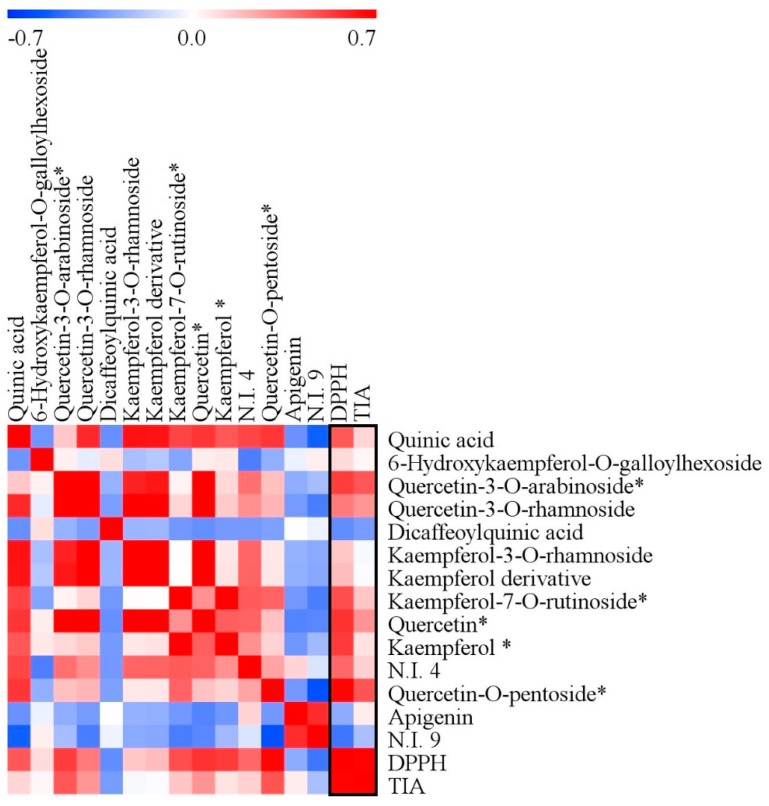
Figure 5.
Correlation map of metabolites analyzed by ultrahigh performance liquid chromatography (UHPLC)-linear trap quadrupole-ion trap (LTQ-IT) mass spectrometry/mass spectrometry (MS/MS) with antioxidant and tyrosinase inhibition activities. Each square indicates r (Pearson’s correlation coefficient values for a pair of metabolites or antioxidant activity). The red color indicates positive (0 < r < 0.7) correlation and blue color indicates negative (−0.7 < r < 0) correlation. * The correlation coefficients of five metabolites are statistically significant at a level of 0.05 in bioactivities.

