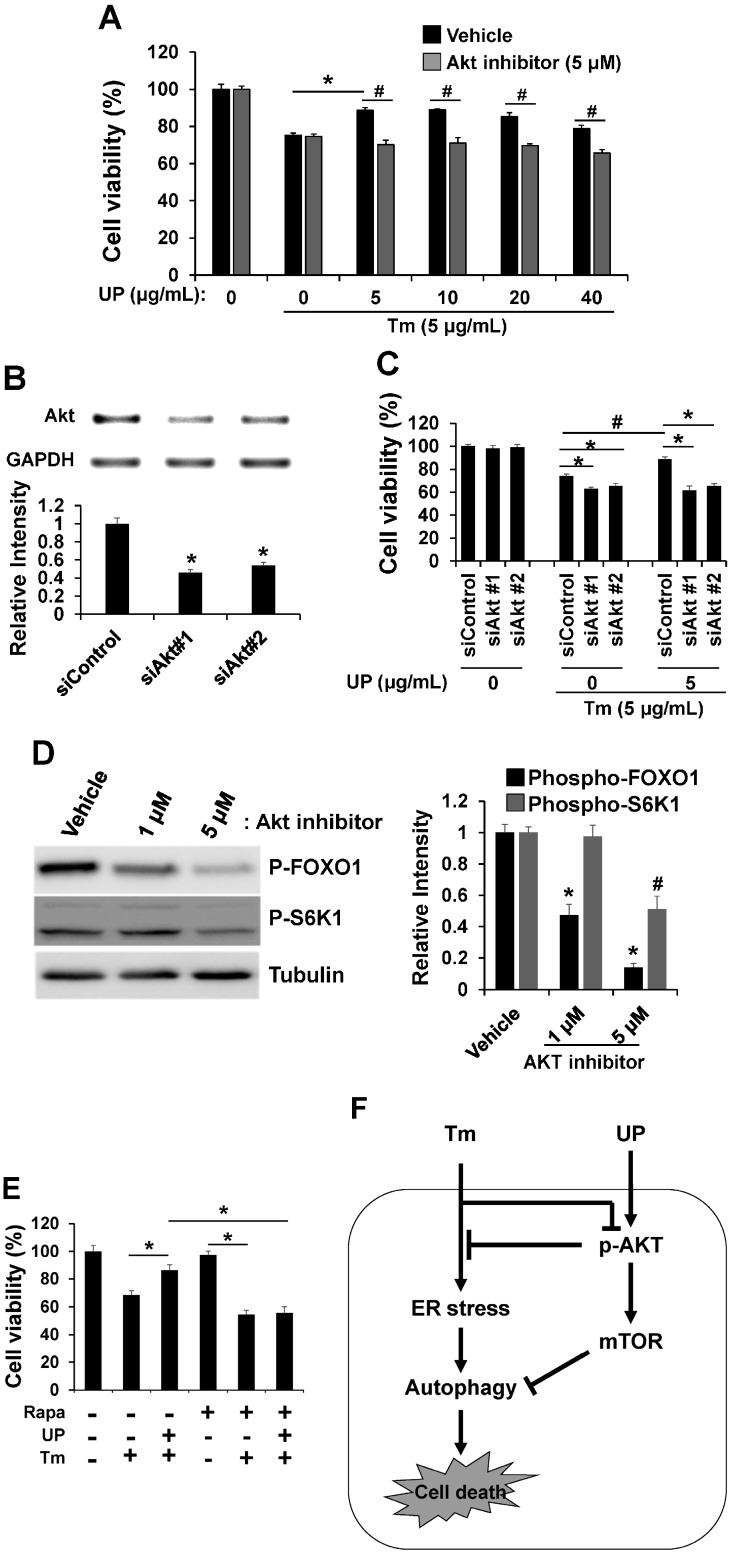
Figure 5.
Role of AKT/mTOR signaling in ER stress-induced cytotoxicity. (A) GT1-7 cells treated with UP were incubated with tunicamycin (24 h) with or without Akt inhibitor and cell viabilities were then assessed by MTT assay. The results are means ± SDs (n = 3); * p values of <0.05 indicate significantly different from treatment with UP. #p values of <0.05 indicate significantly different from treatments without inhibitor; (B) Knockdown of Akt was demonstrated by RT-PCR analysis. Densitometric analysis results are also shown (lower). GAPDH was used as a control. * p values of <0.05 indicate significantly different from control siRNA; (C) Expression of Akt in GT1-7 cells was knockdowned using siRNAs against Akt. GT1-7 cells were treated with tunicamycin (5 μg/mL) with or without UP (5 µg/mL) for 24 h, and cell viabilities were measured with MTT assay. The results shown are means ± SDs (n = 3). * p values of <0.05 indicate significantly different from control siRNA. # p values of <0.05 indicate significant differences from treatments without UP; (D) The levels of phospho-FOXO1 and phospho-p70S6K1 were measured after treatment with Akt inhibitor by Western blotting. Tubulin was detected as a loading control. Densitometric analysis results (right) are also shown; (E) GT1-7 cells treating UP were incubated with tunicamycin (24 h) with or without rapamycin, mTOR inhibitor, and cell viabilities were assessed by MTT assay. The results are means ± SD (n = 3); * p values of <0.05 indicate significant differences between the conditions indicated; (F) Hypothetical model depicting a central role of UP in ER stress-induced cell death.

