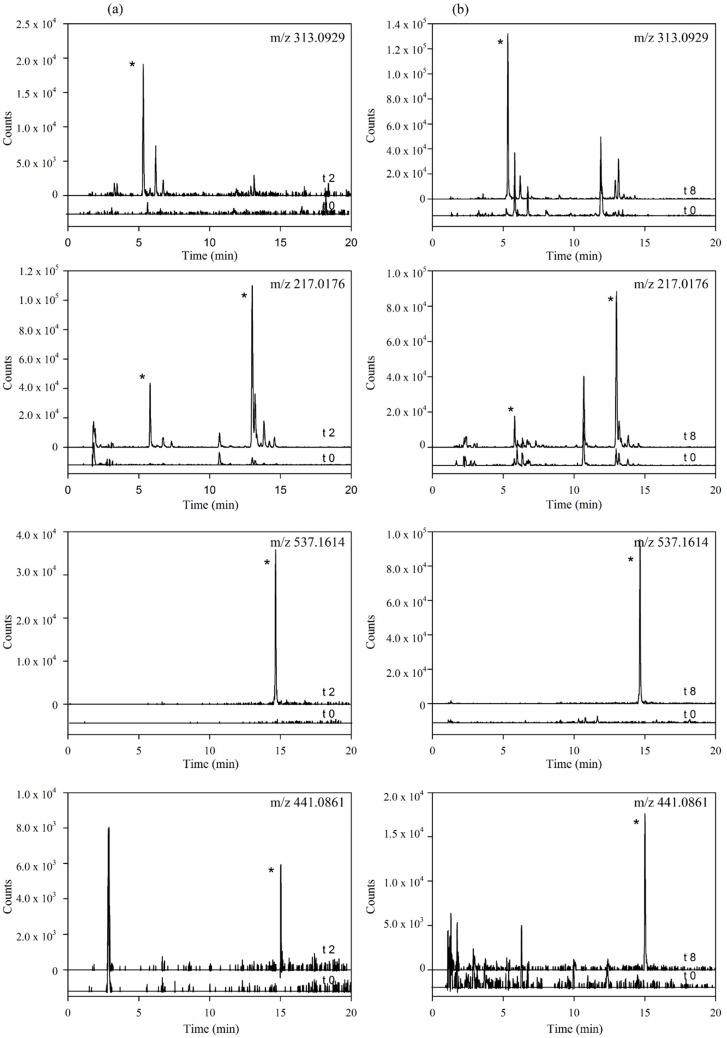
Figure 3.
Extracted Ion Chromatograms (EICs) of the main targeted metabolites identified in (a) plasma samples (time 0 vs. 2 h) and (b) urine samples (time 0 vs. 8 h). (* indicate peaks corresponding to the metabolites identified for each mass in Table 2).

