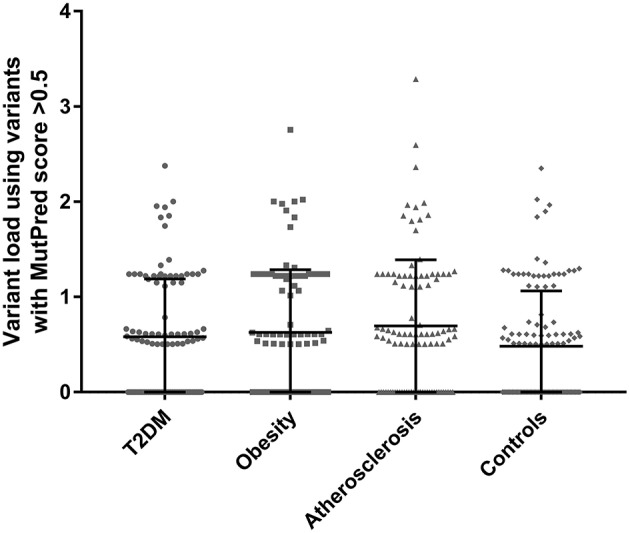
Figure 1.

Total variant loads based on only non-synonymous variants with MutPred score above 0.5 threshold in T2DM (n = 100), obesity (n = 100), atherosclerosis (n = 100) and the control group (n = 115). No significant differences were observed when comparing all groups with one-way ANOVA (p = 0.096). Dunnett's post-hoc test revealed a significant difference between the atherosclerosis cohort and the control group (p = 0.041) in mean total variant load.
