Figure 3.
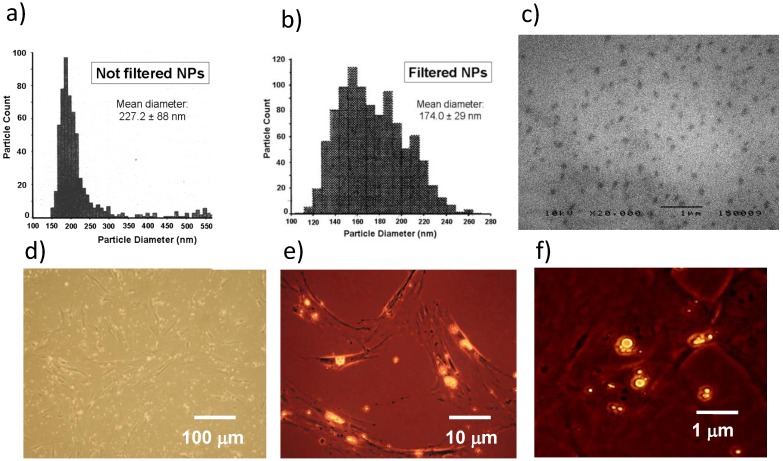
Characterization and cell uptake of NPs. (a) The size distribution of NPs measured just after their production was 150-380 nm. (b) The range of NP diameter was restricted to 110-260 nm after filtration, with a mean value of 174.0 ± 29 nm. (c) NP size and distribution were consistent with the images obtained by SEM. (d, e) BM-MSCs were incubated with Nile Red-loaded NPs and contemporary observed by phase contrast and fluorescence microscopy after 24 h. (f) Most NPs fused into larger aggregates after 48 h. Images are representative of duplicate experiments.

