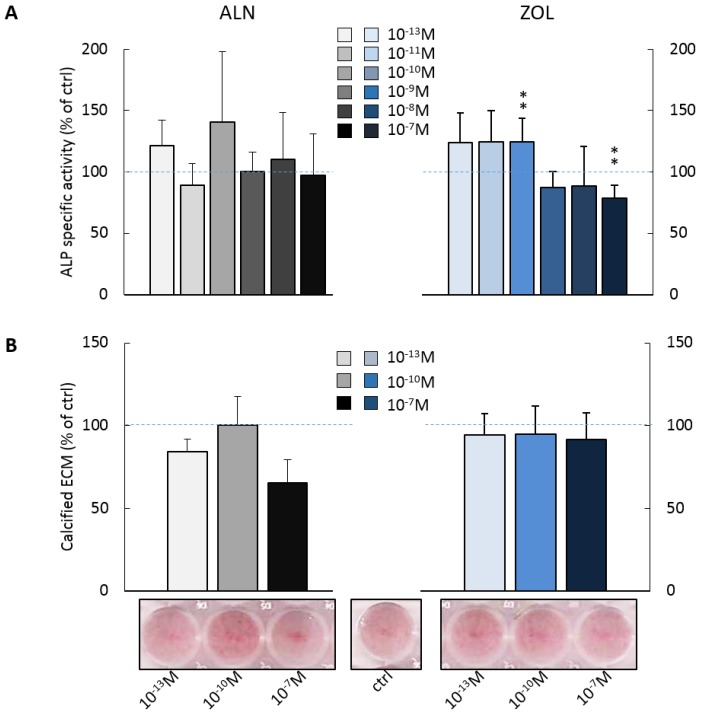
Figure 2.
Effect on ALP activity and calcified ECM deposition of repeated treatments with ALN or ZOL concentrations from 10-13 to 10-7M. Data are represented as relative values setting as 100% the ALP activity (A) or the calcified ECM deposition (B) of untreated pre-osteoblasts (ctrl, blue dashed lines). Representative macrographs of Calcium nodules stained with Alizarin Red-S dye are shown. Results are expressed as mean ± SEM of at least 3 independent experiments for each condition. Statistical significance versus ctrl is shown as **p<0.01.

