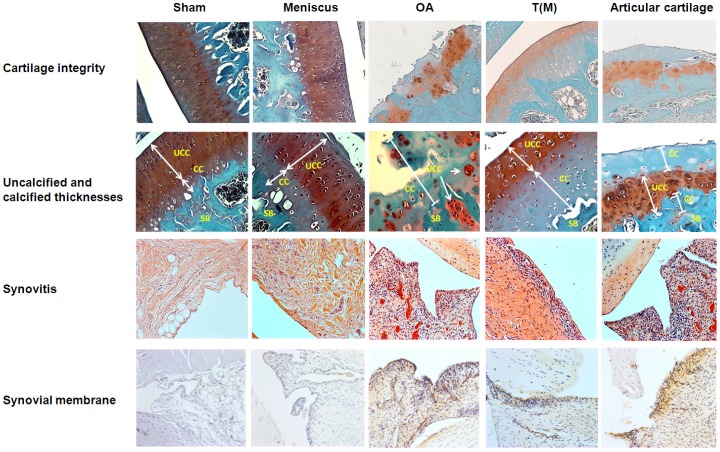
Figure 3.
The analysis of cartilage and synovial membrane. For the cartilage integrity, OA and Articular cartilage groups displayed more severe damage of cartilage as compared with other groups by Safranin-O staining. The magnification of the image was ×200. In the measurements of UCC and CC thicknesses, OA and Articular cartilage groups had small layers of CC thickness because of the severe erosions at the cartilage regions. The magnification of the image was ×400. To accesses the degree of synovitis by HE staining, the OA and Articular cartilage groups showed the higher levels of cell layer, hyperplasia and cell infiltration in synovial membranes by compared with other groups. The magnification of image was ×200. The synovial membrane of IHC stain was measured the expression level of IL-1β. The high level of accumulation of cell layers and expression of IL-1β were observed in OA and Articular cartilage groups than other groups. The magnification of image was ×200. All rats were n=10.

