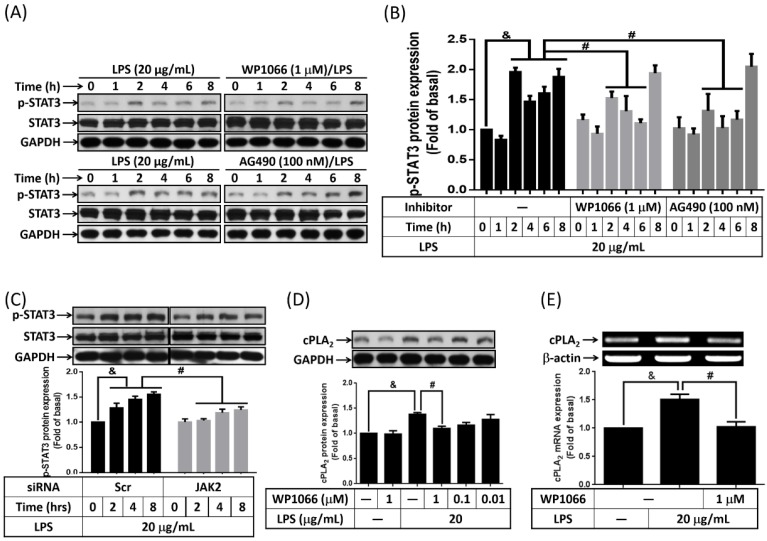
Figure 3.
Activation of STAT3 contributed to LPS-regulated cPLA2 gene expression. Serum-starved 3T3-L1 cells were pretreated with AG490 (100 nM) or WP1066 (1 μM or different concentration) for 1 h. Or cells were transfected with 100 nM of scramble (Scr) or siRNA for 24 h. At the end of inhibitor or siRNA treatment, cells were incubated 20 μg/mL of LPS for the indicated time points (A, B, C), 16 h (D) or 6 h (E). Cells were harvested and cell lysates or mRNA were extracted. (A, C, D) Western blot was used to evaluate the phosphorylation of STAT3, total STAT3 or cPLA2 protein. (B) The phosphorylated STAT3 was quantified and showed as bar graph. (E) RT-PCR was used to analyze the expression of cPLA2 mRNA. Data are expressed as means ± SEM of at least 3 independent experiments (n≥3). &P < 0.05, as compared with the 0 point group or the indicated group. #P < 0.05, as compared with the same time points or LPS treated alone.

