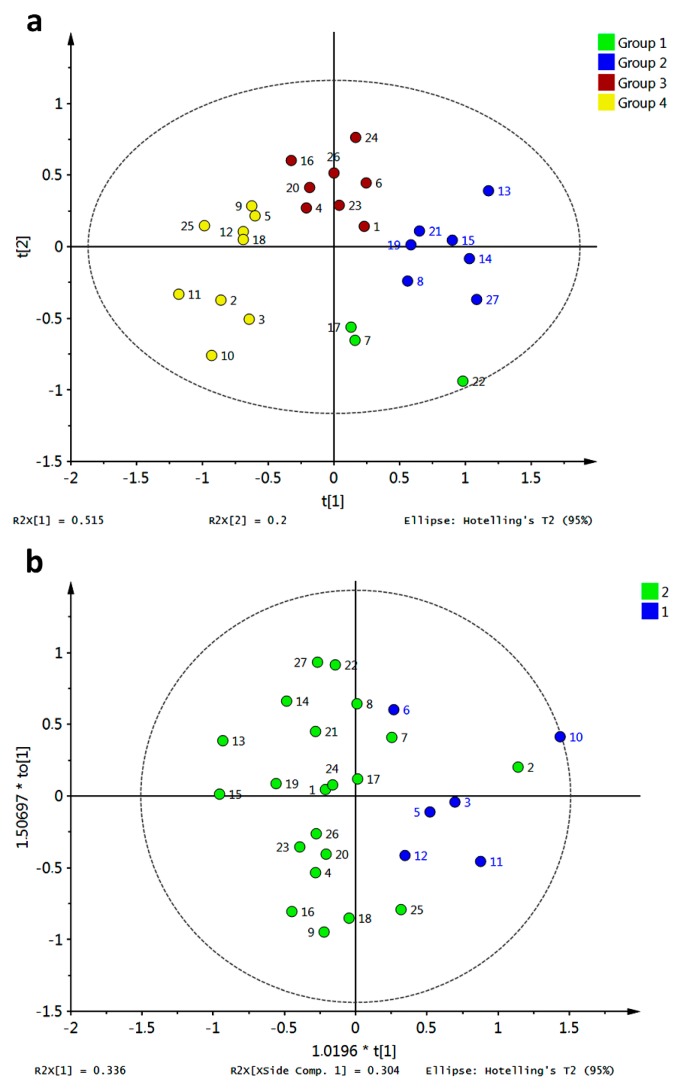
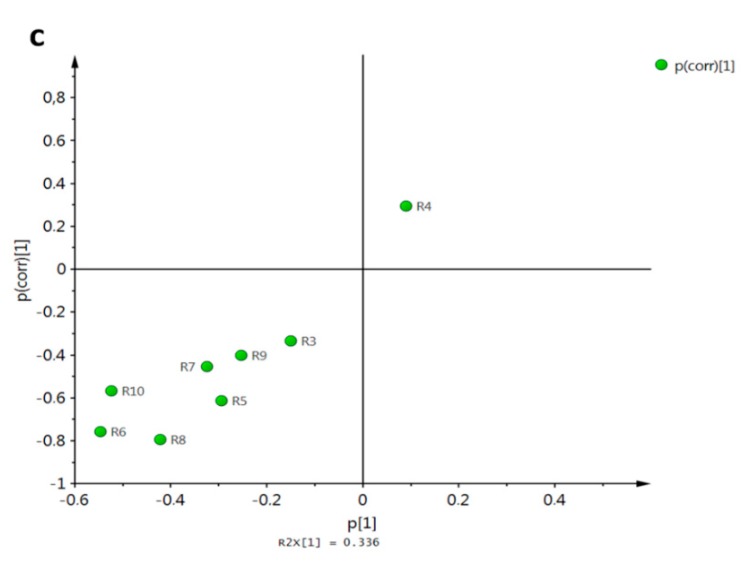
Figure 17.
Discrimination of simple xanthones by antifungal activity against M. canis and E. floccosum based on docking scores (a) PCA score plot grouped according to HCA; (b) OPLS-DA score plot employing antifungal activity as classification variable (group 1: high to medium activity; group 2: low to absent activity); (c) S-plot from OPLS-DA.


