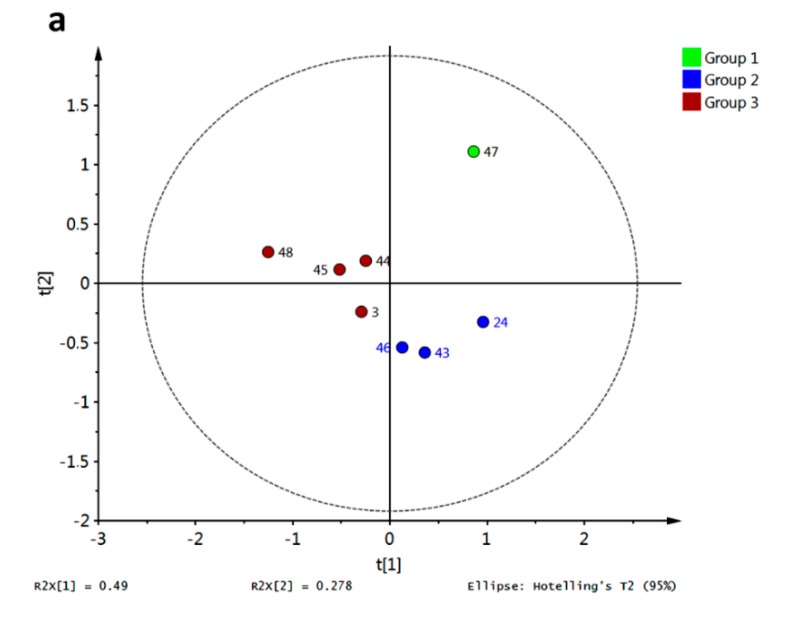
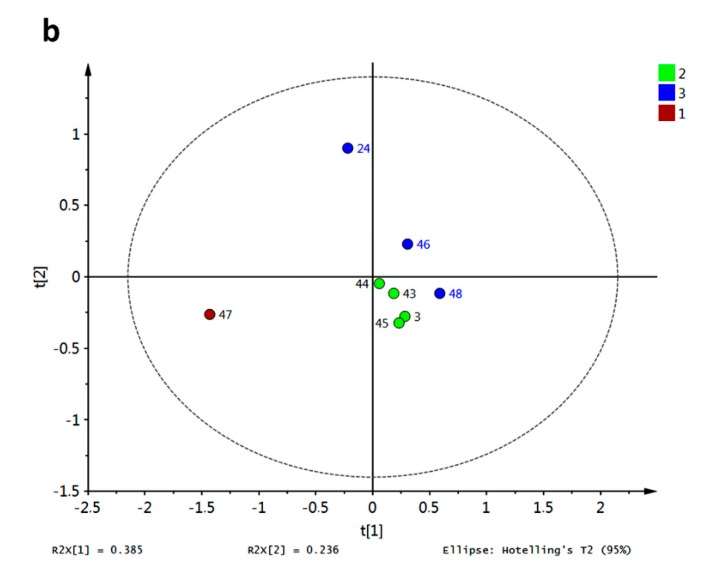
Figure 18.
Discrimination of simple xanthones by antifungal activity against A. flavus based on docking scores. (a) PCA score plot grouped according to HCA; (b) PLS-DA score plot employing antifungal activity as classification variable (group 1: highest activity; group 2: medium activity; group 3: lowest activity).


