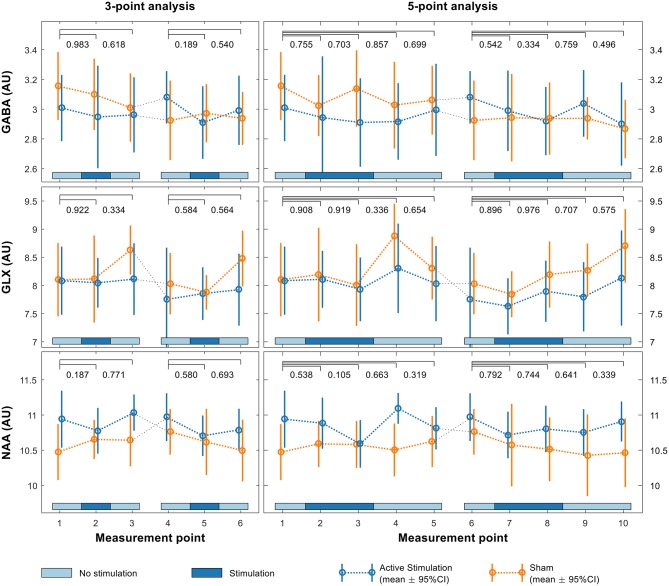
Figure 4.
Linear mixed effects model of GABA (upper row), Glx (middle row) and NAA (lower row) levels in the pSTG for both the first and second sessions using both 3-point (left) and 5-point (right) analyses. p-values shown above each plot indicate significance of interaction effects at each time point relative to baseline.

