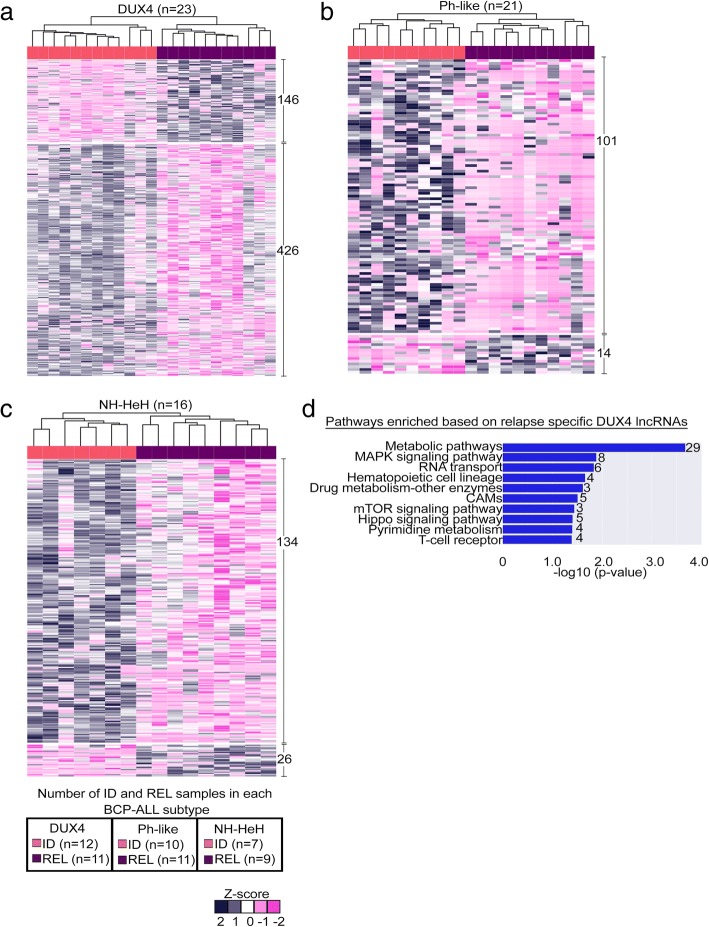
Fig. 3.
Relapse-specific DE lncRNAs from BCP-ALL subtypes. a–c Heatmap depicting the hierarchical clustering on relapse-specific DE lncRNA signature on z-score transformed LIMMA normalized expression values from DUX4, Ph-like, and NH-HeH subtypes. Each heatmap shows the up- and downregulated lncRNAs specific to ID and REL samples. d Molecular pathway analysis with the number of genes involved in each pathway from the enrichment analysis of the nearby (< 100 kb proximity) cis protein-coding genes correlated (Pearson correlation > 0.55 and P value ≤ 0.05) with relapse-specific DE lncRNAs in the DUX4 subtype. The legend box indicates the number of ID and REL samples within each group. Abbr.: CAMs; cell adhesion molecules

