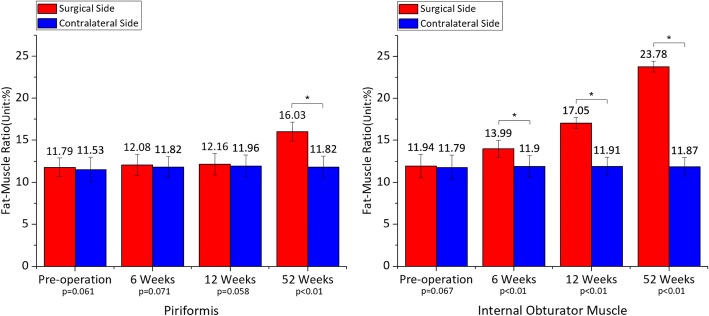
Fig. 5.
Mean ± standard deviation of fat-muscle ratio on the operated side in comparison with the contralateral side from pre-operation to 52 weeks postoperatively. a The fat-muscle ratio of piriformis increased by 0.26% (p = 0.061) preoperatively, 0.26% (p = 0.071) at 6 weeks, 0.20% (p = 0.058) at 12 weeks and 4.21% (p < 0.01) at 52 weeks. b The fat-muscle ratio of internal obturator muscle increased by 0.15% (p = 0.067) preoperatively, 2.09% (p < 0.01) at 6 weeks, 5.14% (p < 0.01) at 12 weeks and 11.91% (p < 0.01) at 52 weeks

