Fig. 1.
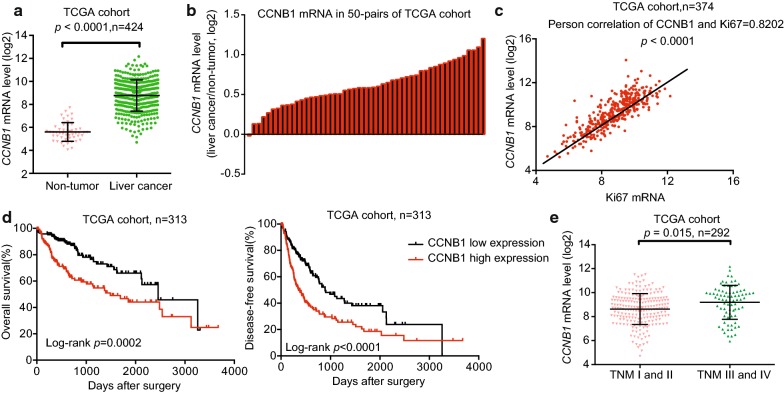
Bioinformatics analysis of CCNB1 in HCC tissues and normal liver tissues using TCGA cohort public database. a Comparison of CCNB1 mRNA levels in HCC tissue and non-tumor tissues in the TCGA database. The expression of CCNB1 was normalized using a logarithm. p < 0.0001, n = 424. b Comparison of CCNB1 mRNA levels in 50 pairs of HCC tissues and adjacent non-tumor tissues. c Pearson correlation between CCNB1 mRNA level and proliferation marker Ki67 mRNA level. p < 0.0001, n = 374. d Kaplan–Meier analysis of the overall survival and disease-free survival time of patients with high or low CCNB1 expression, n = 313. e The expression of CCNB1 mRNA level in HCC patients with different TNM stages (p = 0.015, n = 292)

