Fig. 4.

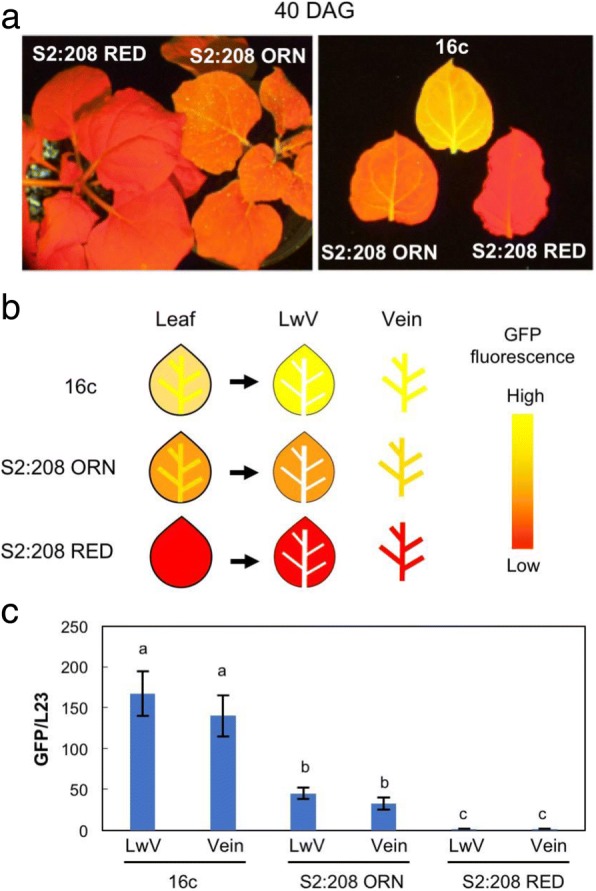
Segregated GFP fluorescence pattern in the S2:208 plants. a GFP fluorescence of the S2:208 RED and S2:208 ORN. Photographs were taken at 40 DAG. Red-colored fluorescence by chlorophyll autofluorescence was observed in S2:208 RED, while S2:208 ORN showed orange-colored fluorescence that were intermediate phenotype between 16c and S2:208 RED. b Schematic illustration of preparation of the leaf samples; leaf veins tissues (Vein) were separated from the other parts of leaf blade (leaf without veins, LwV) and used subsequent experiments. c Expression levels of the GFP gene in Vein and LwV tissues from S2:208 RED and S2:208 ORN. Values represent means of three biological replicates. Error bars represent standard deviations. Data were analyzed using the Tukey-Kramer test. Different lowercase letters on error bars indicate a significant difference at the 5% level between the means
