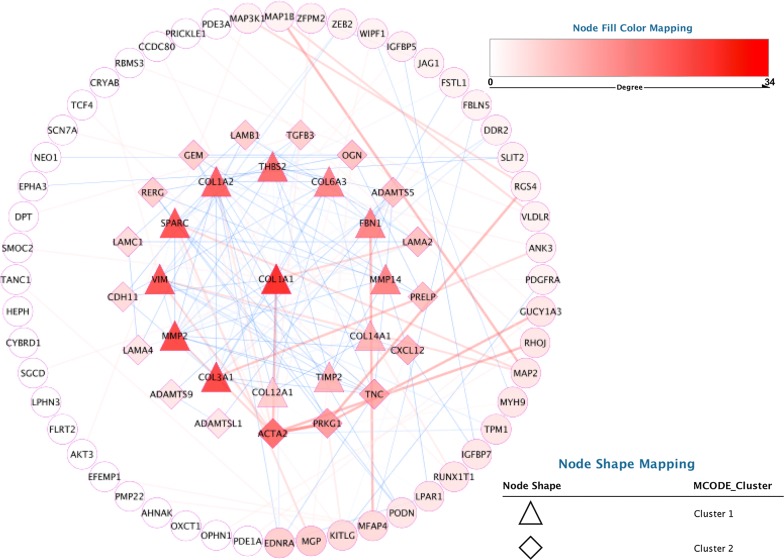
Fig. 5.
The protein–protein interaction analysis of the differentially expressed genes. Protein–protein interaction network of the module genes. Edge stands for the interaction between two genes. A degree was used for describing the importance of protein nodes in the network, red shows a high degree and blue presents a low degree. The significant two modules identified from the protein–protein interaction network shown with triangle (cluster 1) and diamond (cluster 2) using the molecular complex detection method with a score of > 6.0

