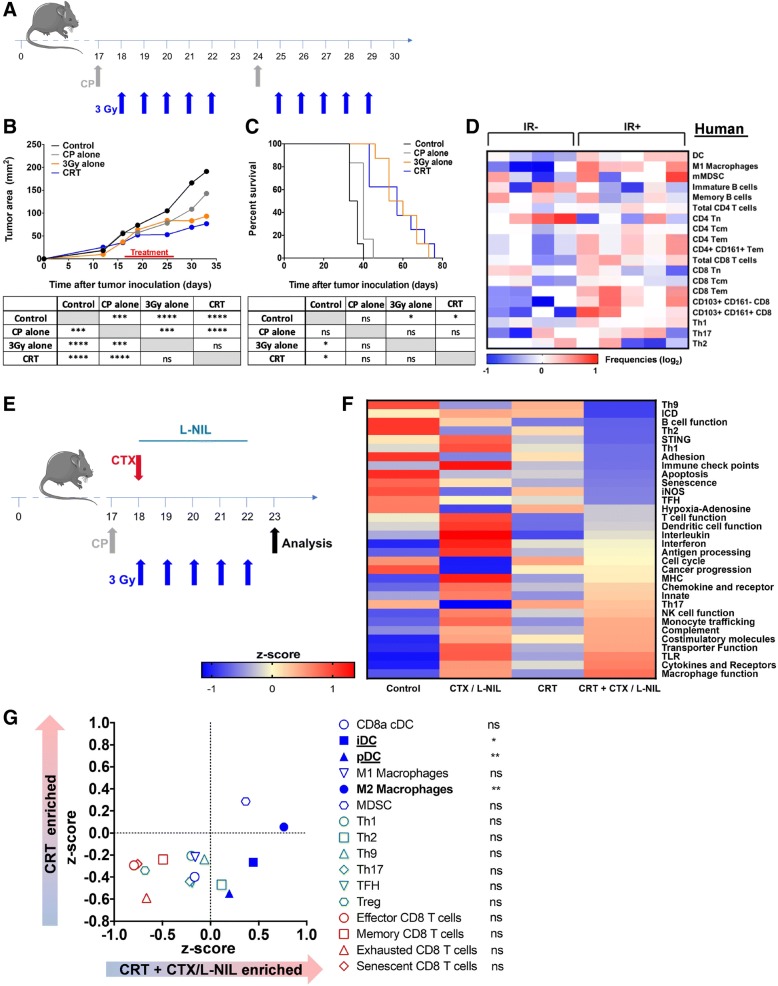
Fig. 1.
CTX / L-NIL reverses the unfavorable immune microenvironment of CRT treated tumors. a-c Subcutaneous established mEER tumors (day 17–18 post tumor cell injection) were treated with tumor-directed radiation (5 X 3Gy) and/or weekly cisplatin (83 μg/mouse) i.p. injections, according to the schedule in (a); mice were euthanized when tumors reached 225 mm2. b Average tumor area (top) and statistical comparison of tumor sizes at time of first euthanasia (bottom; Tukey’s multiple comparison test). c Survival curves (top) and statistical comparison between treatments (bottom; Log-rank test); (b and c; N = 1 representative of 2; n = 6–8/group). d Heatmap depicting the relative abundance of various immune cell populations from CyTOF analysis in HPV16 immune reactive (IR+) and non-reactive (IR-) OPSCC human tumors based on the presence of HPV16-specific tumor infiltrating lymphocytes (TIL). Frequencies of DC (CD14-HLADR+CD11c+), M1 macrophages (CD163−CD14+HLA-DR+), monocytic MDCS (mMDSC; CD14+HLADR−), immature B cells (IgM+CD38+CD20+), memory B cells (IgM−CD38−CD20+), total CD4 and CD8+ T cells, naïve (Tn; CD45RA+CCR7+), central memory (Tcm; CD45RA−CCR7+) and effector memory (Tem; CD45RA−CCR7−) CD4+ and CD8+ T cells, CD4+CD161+ Tem, CD103+CD161− and CD103+CD161+ CD8+ T cells. Th-denotation in indicates amount of IFNγ (Th1), IL-5 (Th2) and IL-17A (Th17) produced by the total TIL culture upon phytohemagglutinin stimulation. All data depicted as log-transformed values (base 2) relative to the median for each individual parameter and each column represents an individual patient (n = 9 total patients). e-f Established mEER tumors were treated with CRT and/or CTX/L-NIL immunomodulation (CTX at 2 mg/mouse i.p. and L-NIL at 0.2% in drinking water) and total tumor RNA was extracted and processed for gene expression analysis after 1 week of treatment, according to schedule in (e). f Heatmap of differential immune gene-set pathway enrichment represented as z-scores between treatment groups (See Additional file 1: Table S3 for immune pathway gene list). g Gene-set based immune cell type enrichment comparing CRT and CRT + CTX/L-NIL represented as z-scores (left; See Additional file 1: Table S4 for immune cell type gene list) and statistical comparison for each immune cell type (right; unpaired t test); (e and f; N = 1; n = 9/group). *p < 0.05; **p < 0.01; ***p < 0.001; ****p < 0.0001; ns, not significant

