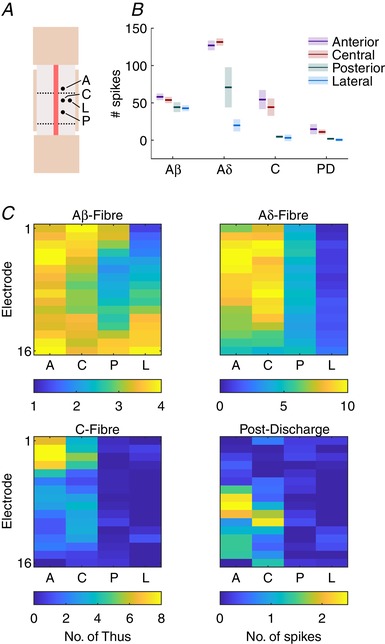
Figure 2. Primary afferent fibres differentially project into the spinal cord and reveal somatotopy.

A, diagrammatic representation of each location that was recorded from. The electrode was first placed in the central location and the relative locations were: 1 mm anterior, 1 mm posterior, or 0.3 mm lateral to the central location. At each location a train of 20 stimuli (5 mA, 2 ms, 0.015 Hz) was given and the evoked responses recorded (n = 4). B, summed activity of all channels at each latency period (mean ± SD) for each. C, heatmaps for mean evoked activity across the array (dorsoventral axis, top–bottom) at each location. Colour bar below denotes colour scale (no. of spikes) for each heatmap. [Color figure can be viewed at wileyonlinelibrary.com]
