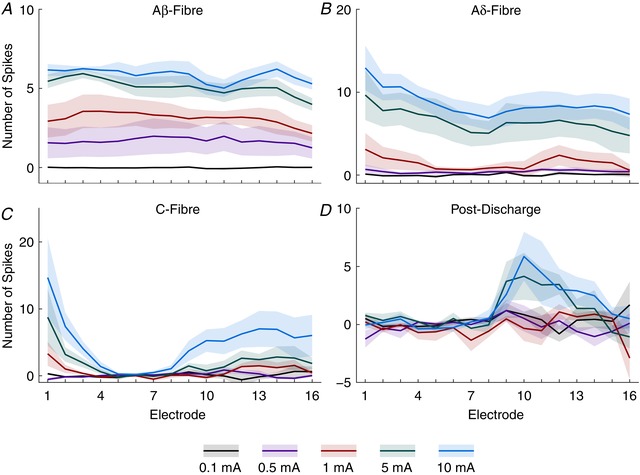
Figure 4. Fibre responses to electrical stimuli of increasing amplitude demonstrate specific thresholds and innervation patterns.

Data from Fig. 3 are shown as the summed activity over time for each fibre latency: Aβ‐ (3–11 ms), Aδ‐ (11–90 ms), C‐fibre (90–300 ms) and post‐discharge (300–800 ms) periods shown for each electrode along the dorsoventral axis and in response to each stimulus intensity. Lines represent mean value and the shaded error shows standard deviation. [Color figure can be viewed at wileyonlinelibrary.com]
