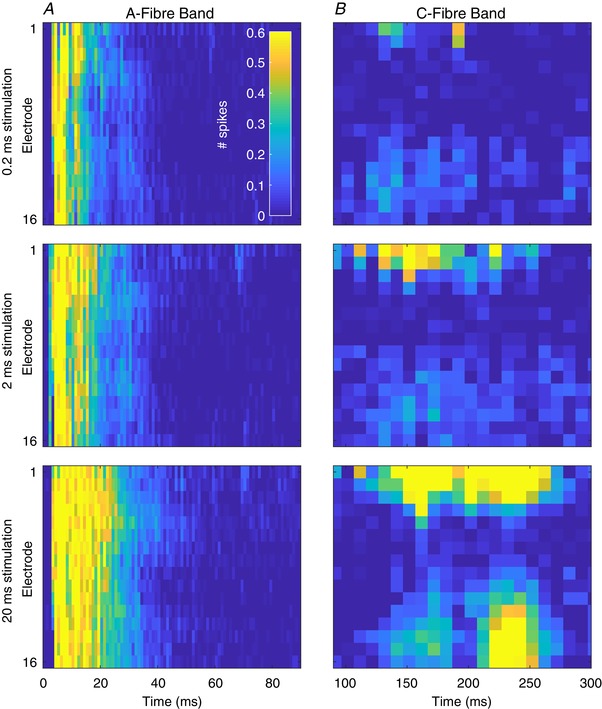
Figure 5. Stimulus duration dependent changes across the dorsal horn reveal fibre‐specific chronaxies.

A, multi‐spike activity (MSP) in the A‐fibre band (0–90 ms after stimulus, 1 ms resolution) at each channel (dorsoventral axis of dorsal horn, top‐bottom) in response to 1 ms (top), 2 ms (middle) and 10 ms (bottom) electrical stimulation of 5 mA. B, corresponding MSP activity in the C‐fibre period (90–300 ms after stimulus) in response to each stimulus (note x‐axis time scales). Summed activity from 10 ms (10 × 1 ms) bins are presented for each channel at each intensity. Maps represent mean response to 20 stimuli of the given intensity from 4 animals. Cell colours correspond to the legend in the top left panel. Data are from 4 animals and are the mean response to 20 stimuli of 2 ms duration at the given intensity. [Color figure can be viewed at wileyonlinelibrary.com]
