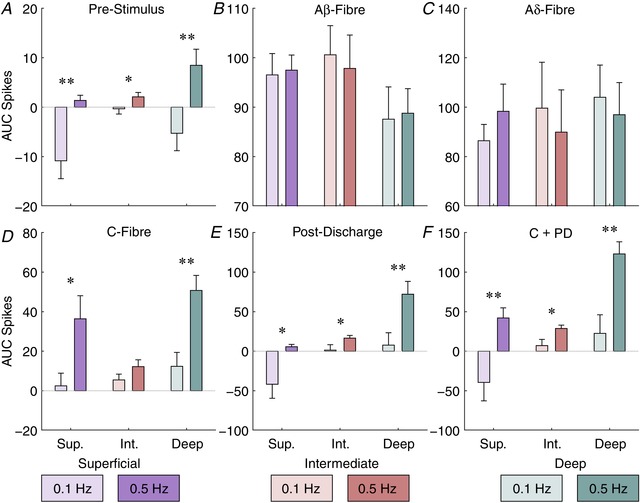
Figure 7. Frequency‐dependent increases in activity are restricted in temporal and spatial dimensions.

The total amount of activity in each latency period was measured for each stimulus in the train and the area under the curve (AUC) calculated for each stimulus frequency (0.1 or 0.5 Hz) and region. Latencies used are: pre‐stimulus, −100 to 0 ms; Aβ, 3–11 ms; Aδ, 11–90 ms; C‐fibre, 90–300 ms; post‐discharge, 300–800 ms; and the combined C‐fibre and post‐discharge (C + PD) period, 90–800 ms. Bars denote mean values whilst error bars show standard deviation. Data are from 3 animals and asterisks indicate where a paired t test detected a difference between trains at that latency and location. Bar colour saturation indicates stimulus frequency. [Color figure can be viewed at wileyonlinelibrary.com]
