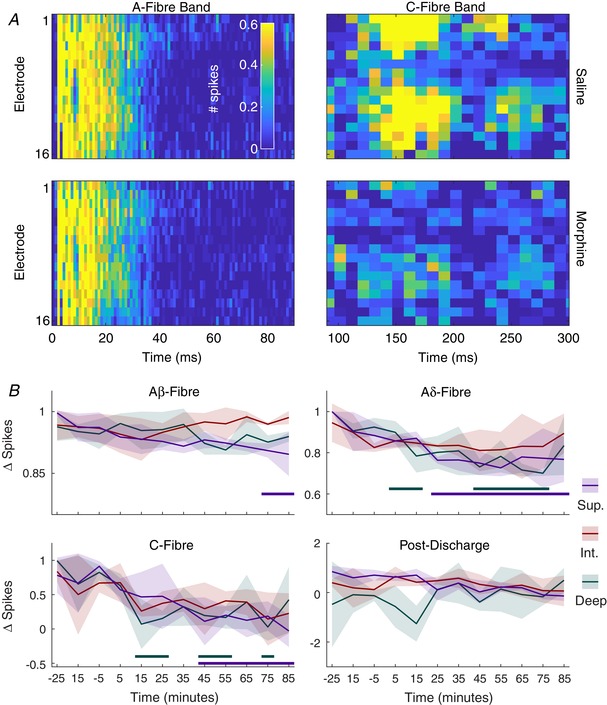
Figure 8. Intrathecal morphine preferentially reduces nociceptive fibre activity throughout the dorsal horn.

A, multi‐spike activity (MSP) heatmaps in the A‐fibre (0–90 ms after stimulus, 1 ms resolution) and C‐fibre (90–300 ms after stimulus, 10 ms resolution) bands at each channel (dorsoventral axis of dorsal horn, top–bottom) after 15 min of saline (−15 min relative to application of morphine) and after 15 min of morphine (5 ng/50 ul) application to the cord. Cells are 2 or 10 ms in duration and colour corresponds to the colour bar in the top left panel. B, data for each time point are broken into fibre latencies and regions so that specific changes may be observed. Values shown are the difference in activity between the time point and the average evoked activity during the saline period. Lines denote mean values whilst shaded areas represent standard deviation. Data are from 3 animals and thick colour coded lines below indicate where the evoked activity was significantly different from the activity in the saline period. [Color figure can be viewed at wileyonlinelibrary.com]
