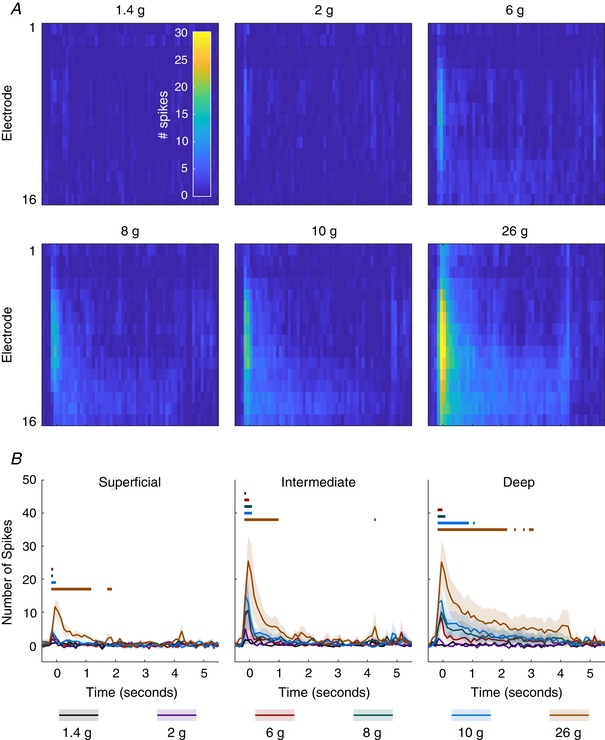
Figure 9. Lamina‐specific activation of graded mechanical stimuli.

A, MSP activity in response to various von Frey hairs applied to the ipsilateral hindpaw for 5 s. Cells represent summed activity in 100 ms bins and colours correspond to inset colourbar in the top left panel. B, activity is averaged across channels to produce activity for each region (superficial, 1:3; intermediate, 4:9; deep, 10:16). Lines indicate mean response across animals (n = 3) and the shaded error shows the standard deviation at each time point. Colour coded lines above indicate time points at which an ANOVA detected a significant difference between the two groups. [Color figure can be viewed at wileyonlinelibrary.com]
