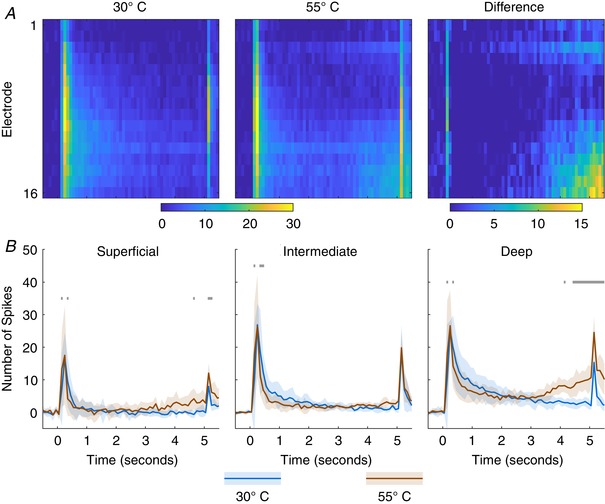
Figure 10. Laminae specific activation of thermal stimuli.

A, MSP activity in response to application of an innocuous (30°C) and noxious (55°C) stimulus applied to the ipsilateral hindpaw for 5 s. Cells represent summed activity in 100 ms bins and colours correspond to colourbar below. B, activity is averaged across channels to produce activity for each region (superficial, 1:3; intermediate, 4:9; deep, 10:16). Lines indicate mean response across animals (n = 3) and the shaded error shows the standard deviation at each time point. Colour coded lines above indicate time points at which an ANOVA detected a significant difference between the time point and the pre‐stimulus period. [Color figure can be viewed at wileyonlinelibrary.com]
