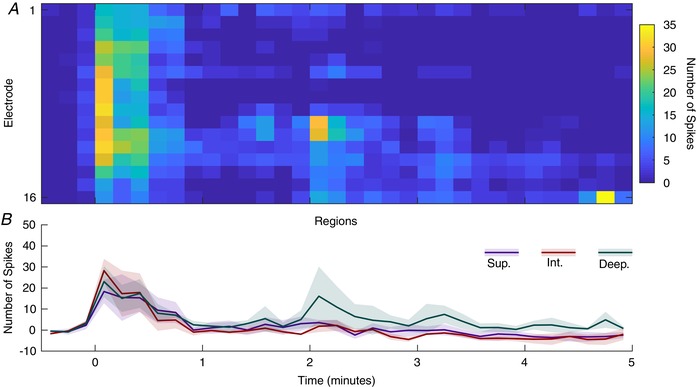
Figure 11. Regional and temporal effects of capsaicin application.

MSP activity following epicutaneous application of capsaicin (2%, 50 μl) to the plantar surface of the hindpaw. A, cells represent the summed activity for 100 ms and colour indicates firing rate as denoted by the colourbar on the right. B, corresponding regions (lines show mean values and shaded error standard deviation). Data are from 3 animals. [Color figure can be viewed at wileyonlinelibrary.com]
