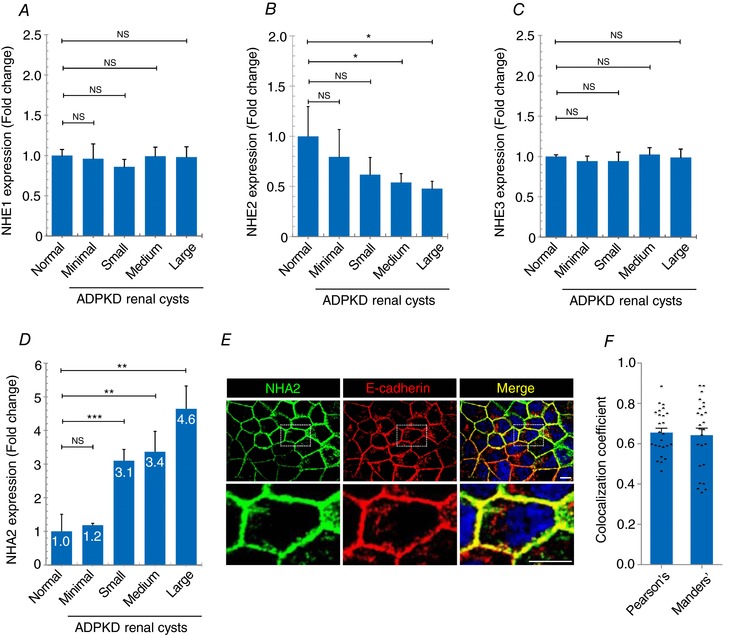
Figure 1. NHA2 is up‐regulated in polycystic kidney disease.

A–C, expression profiling of plasma membrane SLC9A (NHE) genes in ADPKD patient cysts of different sizes showed no change (NHE1 and NHE3) or modest repression (NHE2). D, NHA2 (SLC9B2) expression was increased relative to normal kidney tissue and correlated with cyst size and disease severity. (normal: n = 3; minimal cyst: n = 5; small cyst: n = 5; medium cyst: n = 5; large cyst: n = 3.) Student's t test: NS P > 0.05, * P < 0.05, ** P < 0.01, *** P < 0.001. E, representative confocal microscopic images of MDCK cells stably expressing NHA2–GFP (green) showing colocalization with basolateral marker E‐cadherin (red) in DAPI (blue) stained cells, as seen in the merged image (yellow). Bottom row is higher magnification of boxed region from top row. F, quantification of colocalization. Pearson's correlation coefficient = 0.66 ± 0.11; Manders’ coefficient = 0.64 ± 0.17; n = 25. Scale bar: 10 μm. Error bars are S.E.
