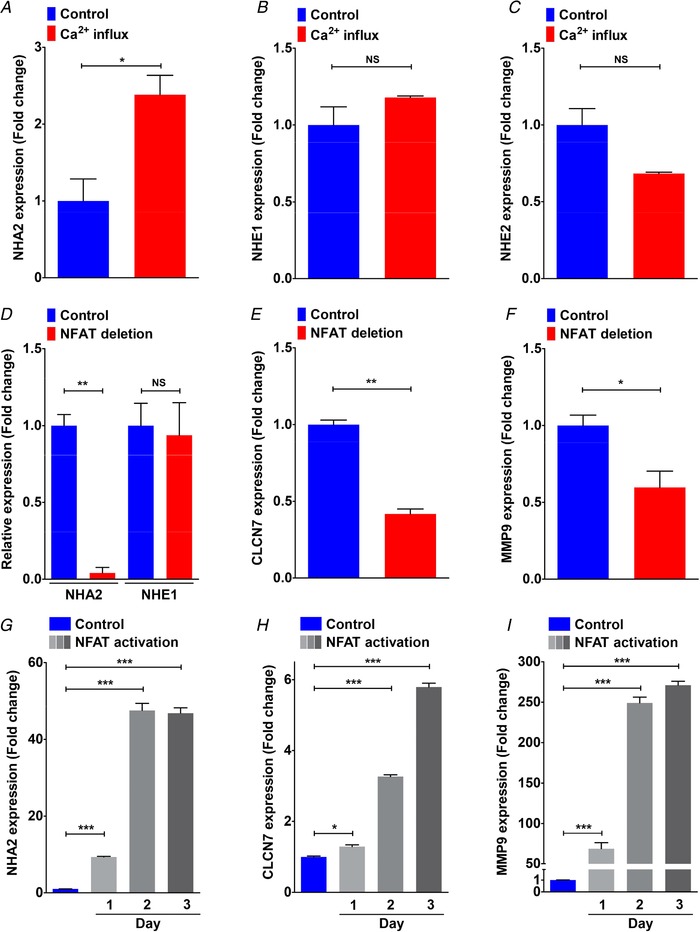
Figure 4. NFAT and Ca2+‐mediated regulation of NHA2 expression.

A–C, gene expression changes in response to Ca2+ influx following treatment with ionomycin and phorbol myristate in human primary T lymphoblasts obtained from the GSE50971 dataset. A, NHA2 showed significant up‐regulation (∼2.4‐fold higher; Student's t test, * P < 0.05). B, NHE1 expression showed no change (Student's t test, NS P > 0.05). C, NHE2 expression was lower, but non‐significant (Student's t test, NS P > 0.05). D, NFATc1 deletion resulted in profound, >95% down‐regulation of NHA2 expression (Student's t test, ** P < 0.01) and no change in related NHE1 isoform (Student's t test, NS P > 0.05) during osteoclast differentiation in vitro. E and F, down‐regulation of well‐known NFAT target genes, CLCN7 and MMP9, is shown for comparison. G–I, gene expression changes were determined from the GSE57468 dataset. In this experiment, mouse bone marrow‐derived osteoclast precursors were treated with RANKL for up to 3 days to differentiate into osteoclasts. G, robust, time‐dependent up‐regulation of NHA2 levels in response to NFAT‐mediated osteoclast differentiation in vitro (∼10‐fold on day 1; ∼50‐fold on day 2–3; Student's t test, *** P < 0.001). H and I, significant up‐regulation of well‐known NFAT target genes, CLCN7 (∼1.3‐fold on day 1, ∼3.3‐fold on day 2, ∼5.8‐fold on day 3; Student's t test, * P < 0.05, *** P < 0.001) and MMP9 (∼69‐fold on day 1, ∼249‐fold on day 2, ∼270‐fold on day 3; Student's t test, *** P < 0.001). Error bars are S.D.
