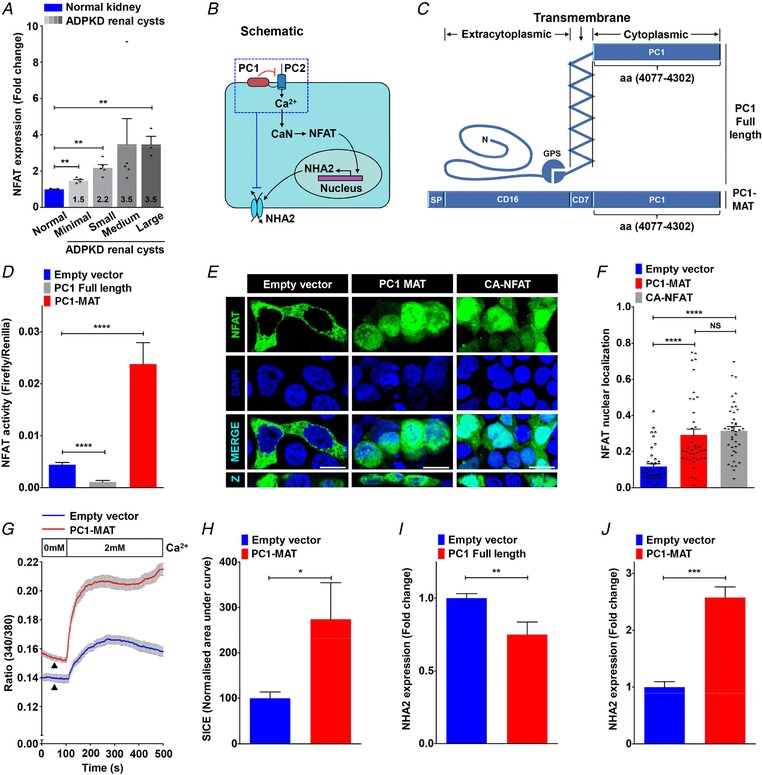
Figure 5. NFAT mediates Ca2+‐dependent NHA2 expression.

A, NFATc1 expression profiling of ADPKD patient cysts of different sizes revealed up‐regulation of NFAT expression relative to normal kidney tissue that correlated with cyst size and disease severity. B, proposed model for PC1‐mediated modulation of Ca2+ homeostasis and regulation of NHA2 expression through calcineurin (CaN) and NFAT signalling. C, schematic representation of full‐length PC1 (top) and membrane‐anchored C‐terminal tail fragment of PC1 (PC1‐MAT) (bottom) containing the C‐terminal tail fragment of PC1 linked to the signal peptide (SP) of CD16 and transmembrane domain of CD7. D, Luciferase assay in HEK293 cells to determine NFAT activation using a 3× NFAT binding sequence that drives a firefly luciferase reporter gene and is measured luminometrically. Renilla luciferase driven by a constitutively active SV40 promoter was used to normalize for variations in both cell number and the transfection efficiency. Expression of full‐length PC1 resulted in reduction (∼4‐fold lower; n = 3; Student's t test, **** P < 0.0001) and of PC1‐MAT resulted in increase (∼5‐fold higher; n = 3; Student's t test, **** P < 0.0001) in NFAT reporter activity, relative to empty vector transfection control. E and F, representative micrographs (E, scale bar= 10 μm) and quantification using Manders’ coefficient (F) determining fractional colocalization of NFAT–GFP (green) with DAPI (blue). Colocalization is evident in the merge and orthogonal slices (Z) as cyan puncta. In vector transfected cells, NFAT–GFP is predominantly localized in the cytoplasm. Note prominent overlap between NFAT–GFP and DAPI, consistent with increased nuclear translocation, in cells expressing PC1‐MAT, similar to cells expressing constitutively active NFAT–GFP (CA‐NFAT) (n = 40/each condition; Student's t test, **** P < 0.0001). G and H, representative Fura‐2 fluorescence ratio traces (G) and quantification (H) showing ∼2.4‐fold increase in store‐independent calcium entry (SICE) in cells transfected with PC1‐MAT (n = 3; Student's t test, * P < 0.05), relative to empty vector transfection. Note a higher baseline with PC1‐MAT, relative to the empty vector control, suggesting higher basal Ca2+ levels with PC1‐MAT expression. I and J, qPCR showing ∼2.6‐fold higher NHA2 expression in cells expressing PC1‐MAT (n = 3; Student's t test, *** P < 0.001) and ∼25% lower NHA2 levels in cells expressing full‐length PC1 (n = 3; Student's t test, ** P < 0.01), relative to empty vector transfection. Error bars S.D.
