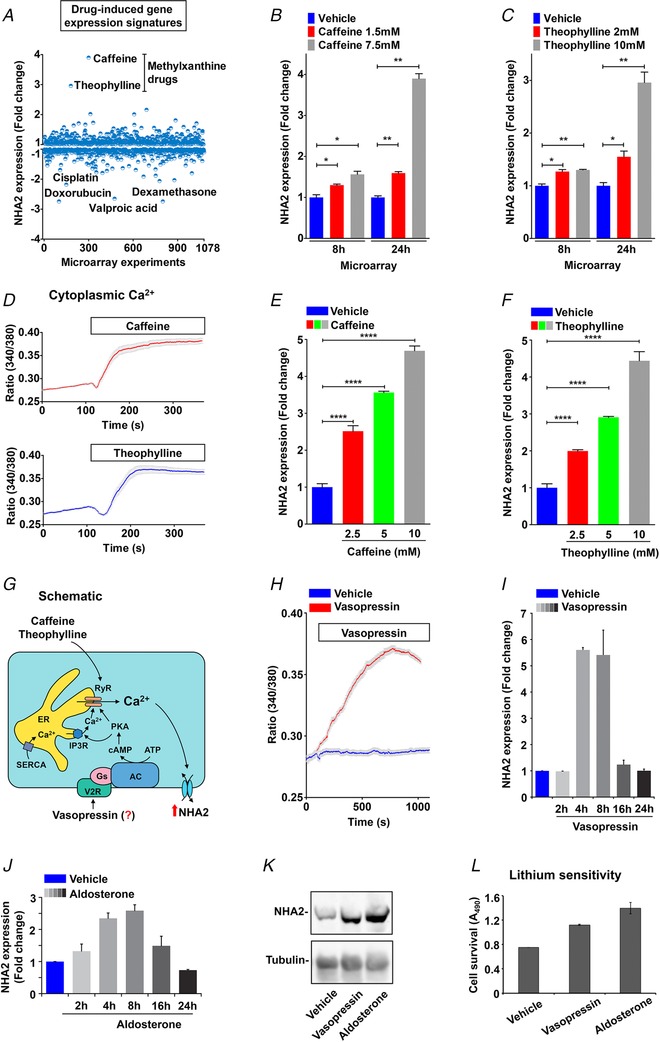
Figure 6. Drug and hormonal regulation of NHA2.

A, expression profiling of NHA2 expression (y‐axis) obtained from an unbiased bioinformatics analysis of 1078 microarray studies (x‐axis), as described in Methods. Note that highest up‐regulation of NHA2 (≥3‐fold) was observed in response to methyl xanthine drugs: caffeine (7.5 mm; 24 h) and theophylline (10 mm; 24 h). Four drugs that resulted in maximal down‐regulation of NHA2 are valproic acid, dexamethasone, cisplatin and doxorubicin. B and C, bar graphs of NHA2 expression derived from microarray analysis of caffeine (1.5 and 7.5 mm; B) and theophylline (2 and 10 mm; C) treatments showing dose‐ and duration‐ (8 h and 24 h) dependent effects. D, representative Fura‐2 fluorescence ratio traces showing significant increase in cytoplasmic Ca2+ with caffeine (top) and theophylline (bottom) treatment in MDCK cells. E and F, qPCR analysis to validate bioinformatic studies documenting significant, dose‐dependent increase in NHA2 expression with caffeine (E) and theophylline (F), relative to vehicle controls in HEK293 cells. G, hypothesis for vasopressin‐mediated regulation of NHA2 expression in renal epithelial cells. Vasopressin stimulation of the V2R receptors results in accumulation of cAMP and activation of PKA. Like caffeine and theophylline, vasopressin‐driven PKA activation stimulates Ca2+ release via the ryanodine receptor channel from the endoplasmic reticulum (ER). Increased cytosolic Ca2+ would in turn increase NHA2 expression. H, representative Fura‐2 fluorescence ratio traces showing significant increase in cytoplasmic Ca2+ with vasopressin treatment in MDCK cells, relative to vehicle control. I, qPCR data showing fold change in NHA2 transcript levels following treatment with vasopressin for indicated time periods ranging from 2 to 24 h. Note significant and phasic increase in NHA2 expression with vasopressin treatment that peaked (∼6‐fold) at 4–8 h and reached baseline by 24 h. J, qPCR data showing fold change in NHA2 transcript levels following treatment of MDCK cells with aldosterone for indicated time periods ranging from 2 to 24 h. Note significant and phasic increase in NHA2 expression with aldosterone treatment that peaked (∼2.6‐fold) at 8 h and reached baseline by 24 h. K, western blot showing NHA2 expression levels following a 6 h treatment of MDCK cells with vehicle (lane 1), vasopressin (lane 2) or aldosterone (lane 3), with tubulin serving as a loading control (bottom panel). L, lithium sensitivity assay to evaluate functional consequences of the hormonal induction of NHA2. Consistent with increased NHA2 mRNA and protein expression, treatment with either vasopressin or aldosterone for 8 h resulted in increased cell survival in medium supplemented with 90 mm LiCl, relative to untreated control. Cell survival in the presence of LiCl was measured using an MTT assay. Error bars are S.D.
